
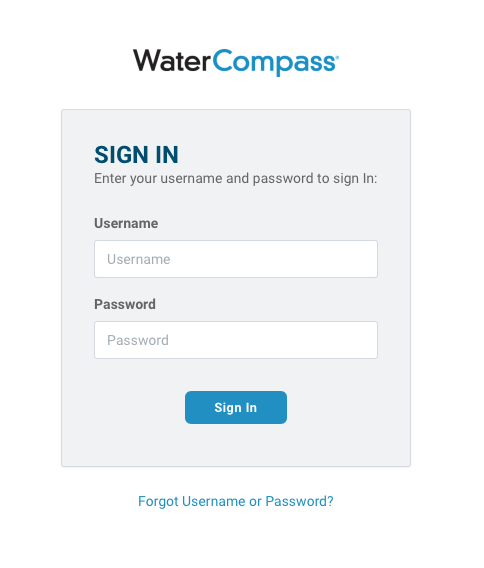
Step 1: Login to the WaterCompass Dashboard
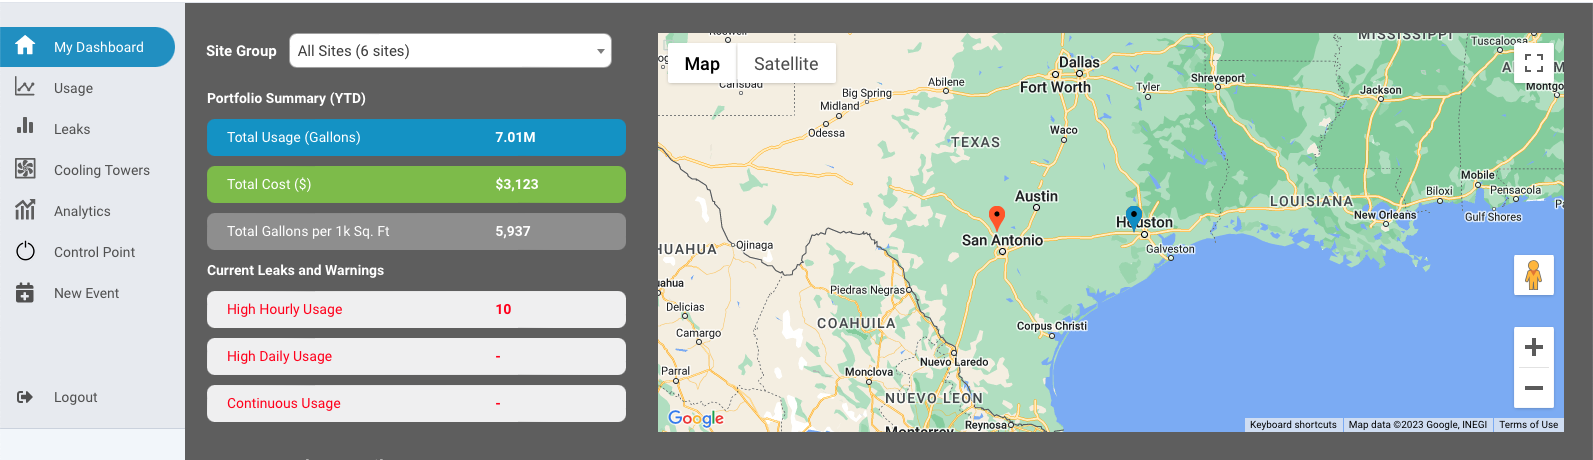
Step 2: Navigate to the Cooling Tower Tab
Cooling Tower Dashboard
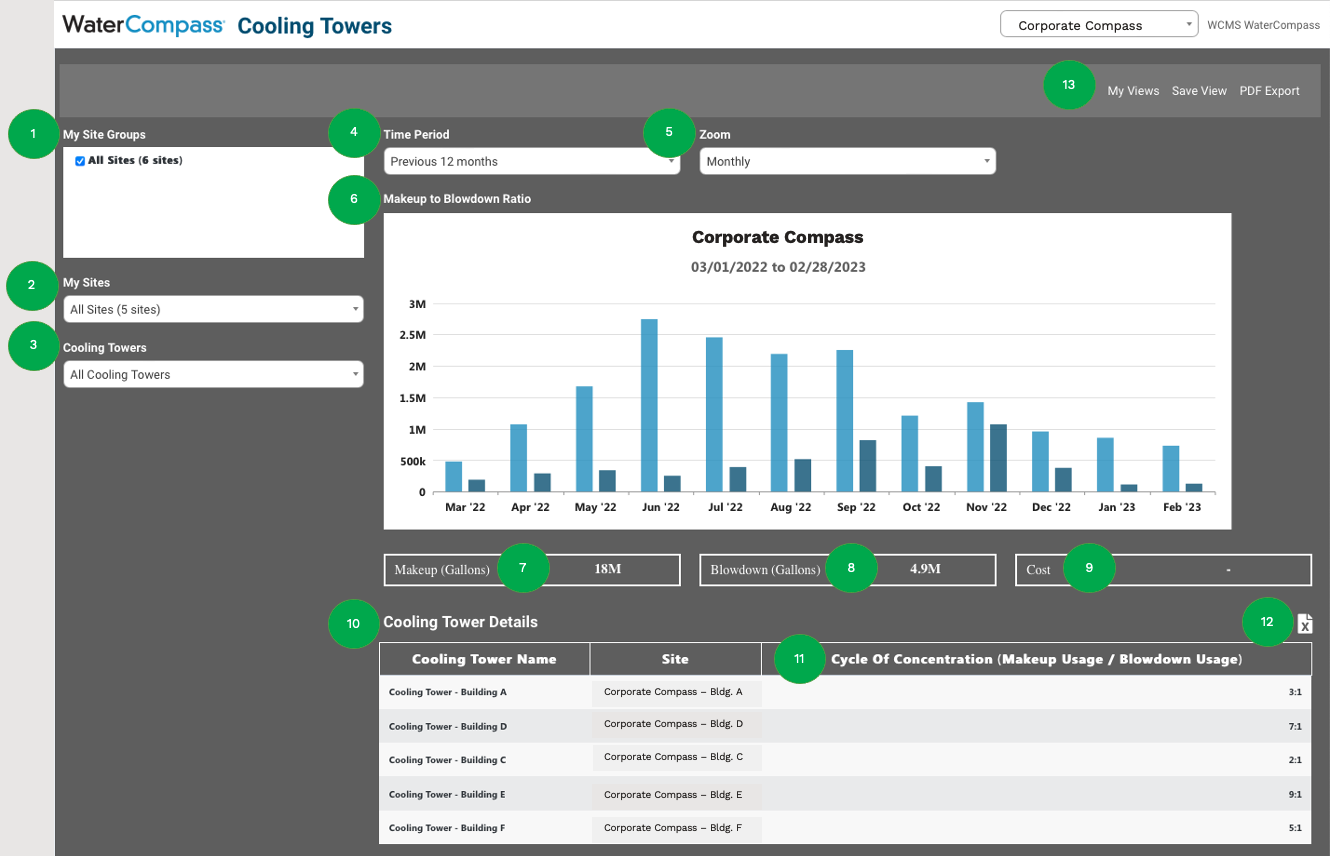
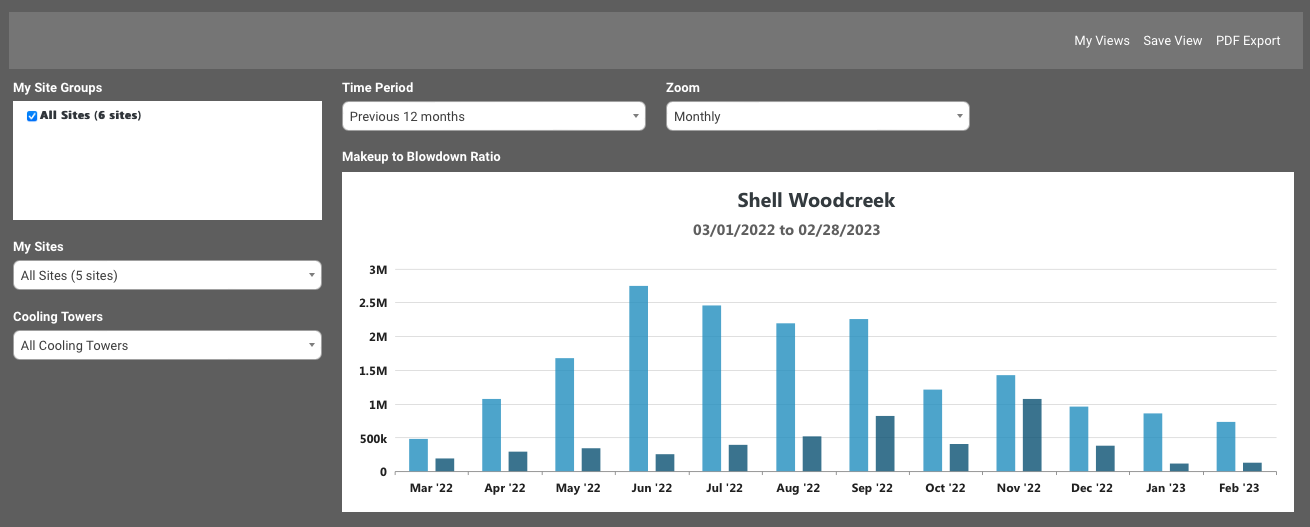
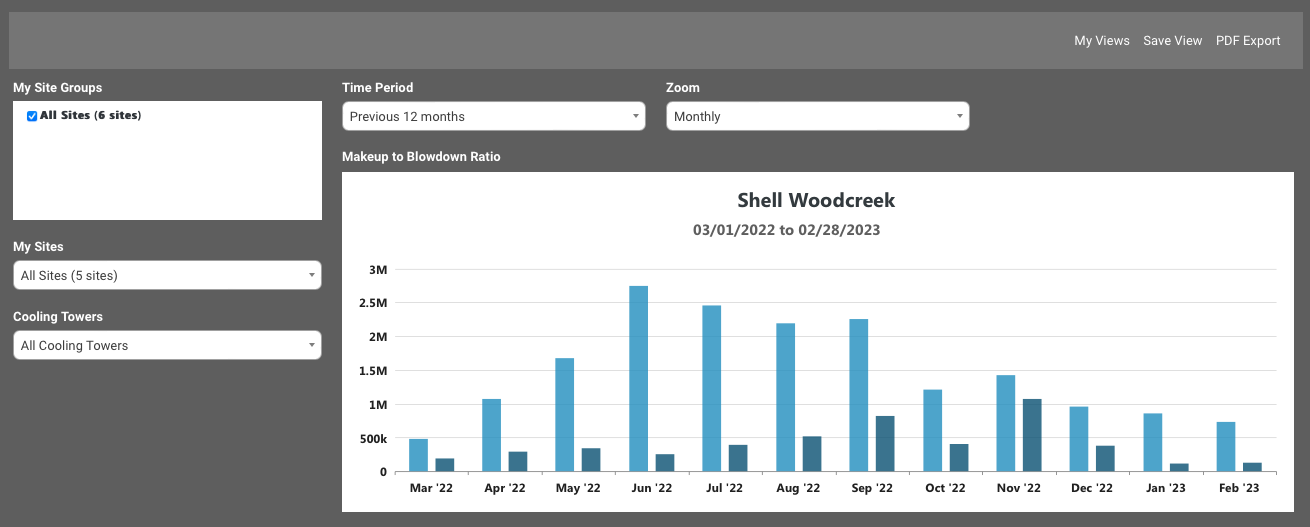
Dashboard Filters
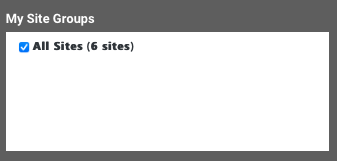
My Site Groups (if applicable): All Sites is a default site group for all accounts. Additional site groups can be created to compartementalize a customers account. Please see article on site groups for information on setting up site groups.
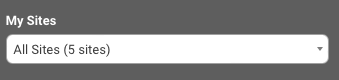
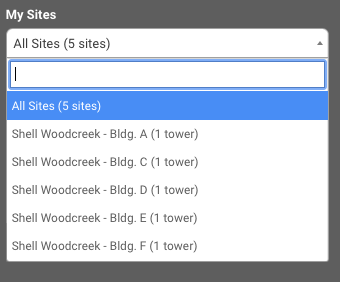
My Sites (Pick-list): View consumption data for all sites within a portfolio together or select individual sites from the pick-list menu.
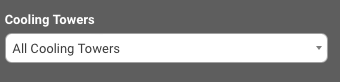
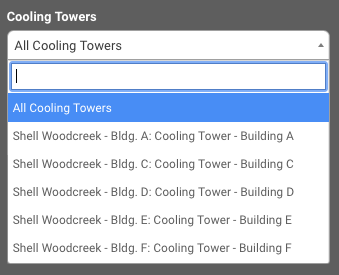
Cooling Towers (Pick-list): View all Cooling Towers within a portfolio together or select individual cooling towers from the pick list menu.
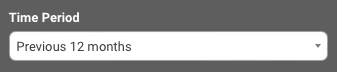
Time Period (Pick-list): Select a time period or date range of data to view.
- Select a default time period
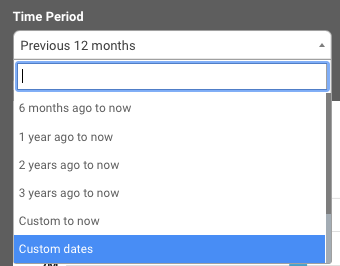
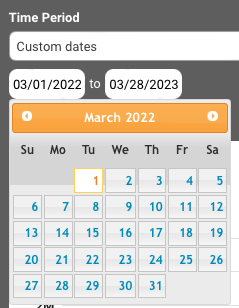
- Select customer date ranges
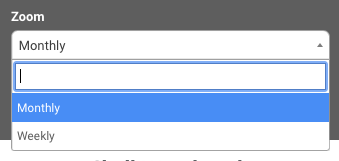
Zoom (Pick-list): Select weekly or monthly data for the time period or date range selected.
Make-Up to Blowdown Ratio
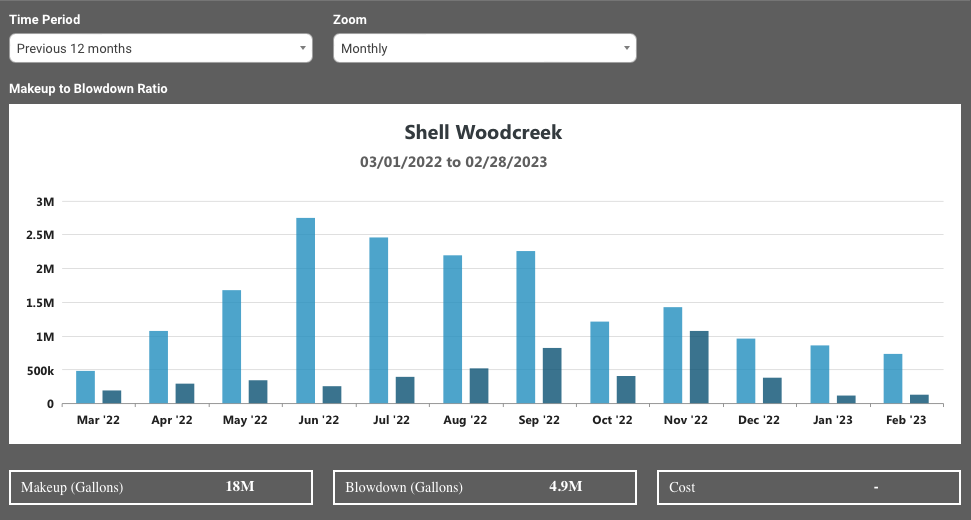
Interactive Graph: View weekly or monthly Make-up and Blowdown consumption side by side.
Makeup (Gallons):
Blowdown (Gallons):
Cost:
Cooling Tower Details
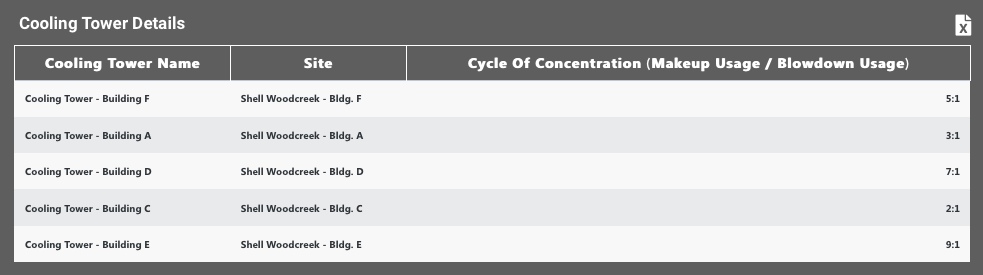
Cooling Tower Name:
Site Name:
Cycles of Concentration:
Saved View
Save View:
My View:
Data Export
PDF Export:
Excel Export:

© Copyright 2023 HydroPoint Data Systems, Inc. All rights reserved. HydroPoint, the HydroPoint logo, and WaterCompass are either registered trademarks or trademarks of HydroPoint, Inc. Other trademarks may be held by their respective owners.