The WaterCompass UltraSonix Dashboard provides a centralized view of device health for both FM250 and FM350 devices. This guide covers how to access the dashboard, interpret each section, and use the diagnostic data to support troubleshooting. For step-by-step resolution workflows, refer to the device-specific troubleshooting articles (FM250 Troubleshooting Guide and FM350 Troubleshooting Guide).
Click here to access the UltraSonix Dashboard→
Devices
Accessing the Device
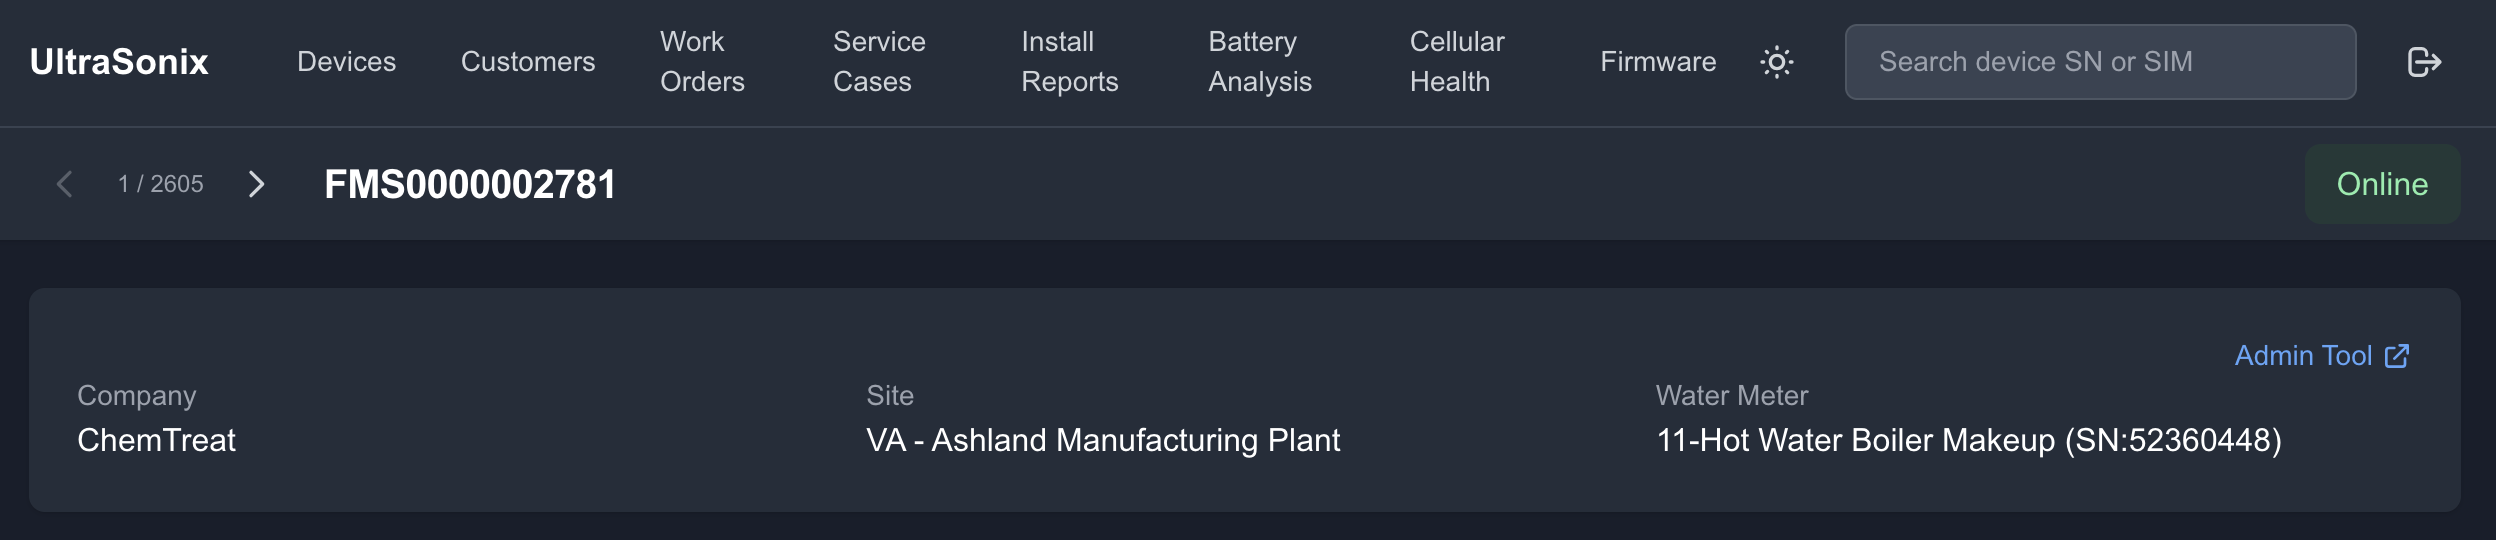
To locate a specific device, enter the device serial number (SN) or SIM number in the search bar at the top right of the UltraSonix dashboard and press Enter.Once a device is loaded, the header displays key identifying information at a glance.What You'll See
- Device Count: Shows the position of the current device within the total fleet (e.g., 1 / 2605).
- Device SN: The unique HydroPoint device serial number (e.g., FMS0000002781). Use the left and right arrows to navigate between devices sequentially.
- Online/Offline Status: A green "Online" badge indicates the device is actively communicating with the server. An "Offline" badge indicates no recent communication.
- Company: The customer account the device is assigned to.
- Site: The physical location where the device is installed.
- Water Meter: The monitoring point name assigned to the device.
- Admin Tool Link: Opens the corresponding device record in the WaterCompass Admin Tool for configuration changes.
Tip: If the Company, Site, or Water Meter fields are blank, the device has not yet been fully provisioned in the Admin Tool. This is common for devices that are staged but not yet installed.
Connection Status
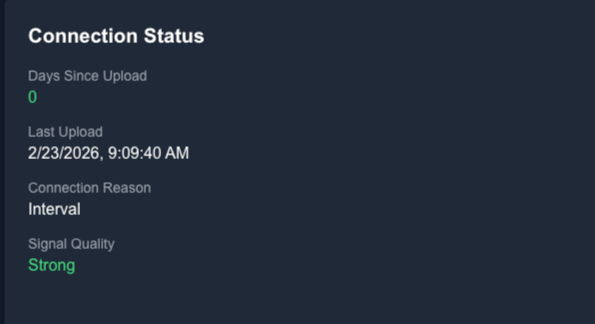
The Connection Status section shows whether the device is actively communicating with the cloud server and the quality of its cellular signal.What You'll See
- Days Since Last Upload: The number of days since the last successful upload. This value should be 0 if the device is communicating as expected.
- Last Upload: The date and time of the most recent successful data upload. If more than 24 hours old, the device may have a communication issue.
- Connection Reason: Displays why the device connected during the last upload, such as the designed interval communication or a button press.
- Signal Quality: A general rating of the device's cellular signal (e.g., Strong, Medium, Weak, No Signal).
How to Use This SectionDuring a support call, check Connection Status first to determine whether the issue is communication-related or flow-related:
- Last Upload is current + flow data is missing → The device is communicating but not detecting flow. Direct the installer to the No Flow or Flow Stopped sections in the device troubleshooting guide.
- Last Upload is stale → The device has lost communication. Check the SNR graph in the Device History section to determine whether signal quality has degraded, then direct the installer to the LTE Cellular Not Connecting section.
- Signal strength is Weak, or No Signal → Antenna relocation or extension is likely required. Initiate a Field Service Request if the issue cannot be resolved on-site.
Installation & Calibration (FM250)
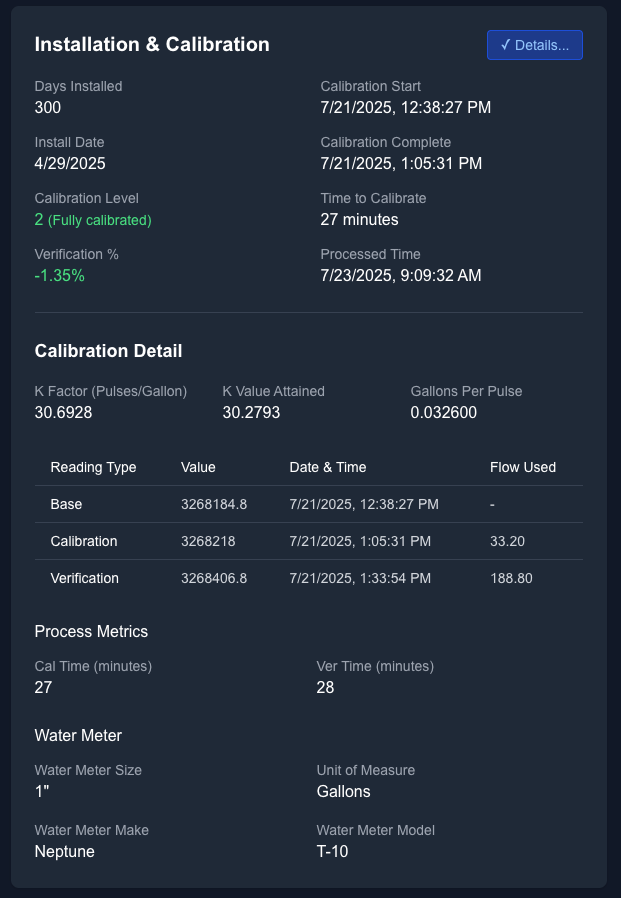
The Installation & Calibration section for FM250 devices provides a complete record of when the device was installed, how its calibration progressed, and the water meter it is paired with. The FM250 uses an intelligent learning process that calibrates the device against the property's water meter over time. This is your primary reference for confirming whether an FM250 has completed that process and is measuring flow accurately.Click the Details button in the top-right corner of this section to expand the full calibration and water meter details.What You'll SeeInstallation Summary
- Days Installed: The total number of days since the device was installed.
- Install Date: The date the device was first activated in the field.
- Calibration Level: The current calibration stage. A value of "2 (Fully calibrated)" indicates the device has completed the learning process and is reporting calibrated flow data. A value of "1" or "0" indicates calibration is still in progress.
- Verification %: The percentage difference between the device's calibrated reading and the verification reading. A value close to 0% indicates high accuracy. Values beyond acceptable thresholds may indicate a calibration issue.
- Calibration Start / Calibration Complete: The date and time range during which the device performed its calibration cycle.
- Time to Calibrate: The total duration of the calibration process.
- Processed Time: The date and time the server processed the calibration data.
Calibration Detail
- K Factor (Pulses/Gallon): The factory-derived conversion rate between pulses detected and gallons measured. This is the baseline reference.
- K Value Attained: The site-specific K Factor that the device calculated during calibration. This value should be close to the K Factor.
- Gallons Per Pulse: The volume of water each detected pulse represents.
- Readings Table: Shows the Base, Calibration, and Verification readings with their respective register values, timestamps, and flow used during each phase.
Process Metrics
- Cal Time (minutes): The time required to complete the calibration phase.
- Ver Time (minutes): The time required to complete the verification phase.
Water Meter
- Water Meter Size: The pipe diameter of the meter the device is installed on (e.g., 1").
- Unit of Measure: The measurement unit configured for this device (e.g., Gallons).
- Water Meter Make / Model: The manufacturer and model of the water meter (e.g., Neptune T-10).
How to Use This SectionDuring a support call, check Installation & Calibration to determine whether the FM250 has been calibrated and is producing reliable data:
- Calibration Level is 0 or 1: The device has not completed calibration. Confirm the install date and check whether sufficient flow has occurred at the site. FM250 devices require consistent flow patterns to calibrate against the water meter. If the device has been installed for more than 30 days without reaching Level 2, escalate for review.
- Verification % is outside the acceptable range: The device may not be measuring flow accurately. Compare the K Factor to the K Value Attained. A significant difference between these values can indicate improper mounting, pipe condition issues, or coupling gel degradation. Direct the installer to verify physical installation.
- Water Meter Make/Model is missing or incorrect: The device may have been provisioned with the wrong meter profile, which affects calibration accuracy. Verify the actual meter on-site and update the Admin Tool if needed.
- Cal Time or Ver Time is unusually long: Extended calibration or verification times can indicate low or intermittent flow at the site, which slows the calibration process.
Installation & Calibration (FM350)
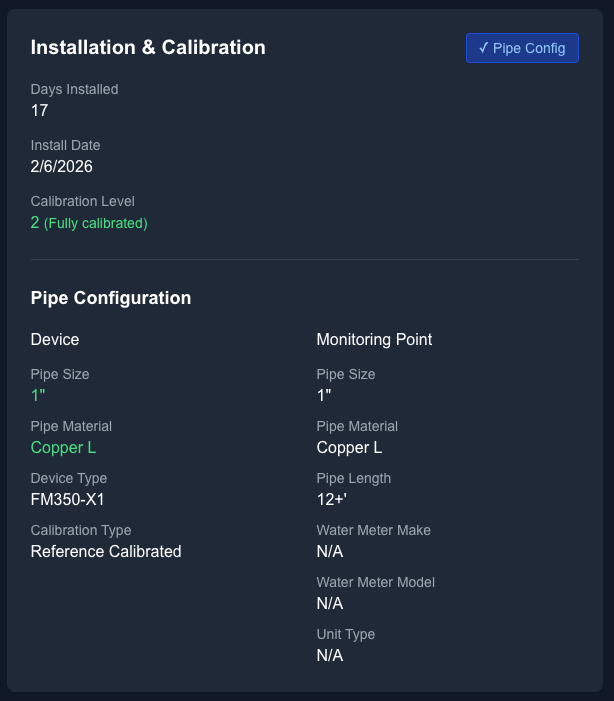
The Installation & Calibration section for FM350 devices shows the device's installation status and pipe configuration. Unlike the FM250, the FM350 does not calibrate against a water meter over time. Instead, it is configured on-site during installation for a specific pipe size and material. The device uses this configuration along with a reference calibration profile to measure flow.Click the Pipe Config button in the top-right corner of this section to expand the full pipe configuration details.What You'll SeeInstallation Summary
- Days Installed: The total number of days since the device was installed.
- Install Date: The date the device was first activated in the field.
- Calibration Level: The current configuration status. A value of "2 (Fully calibrated)" indicates the device has been successfully configured and is reporting flow data. Despite the label, this does not reflect a learning-based calibration — it confirms that the FM350's pipe configuration has been applied and the device is operational.
Pipe ConfigurationThe Pipe Configuration panel displays two columns side by side: the Device column (what the physical device is reporting) and the Monitoring Point column (what is configured in the system). These values should match. A mismatch between the two columns indicates a configuration error that will affect measurement accuracy.Device column:
- Pipe Size: The pipe diameter the device is configured for (e.g., 1"). Displayed in green when the value matches the Monitoring Point.
- Pipe Material: The pipe material the device is configured for (e.g., Copper L). Displayed in green when the value matches the Monitoring Point.
- Device Type: The hardware model (e.g., FM350-X1).
- Calibration Type: The calibration method used (e.g., Reference Calibrated). This indicates the device uses a factory reference profile for the configured pipe type rather than a site-specific learning process.
Monitoring Point column:
- Pipe Size: The pipe diameter configured in the Monitoring Point record.
- Pipe Material: The pipe material configured in the Monitoring Point record.
- Pipe Length: The length of straight pipe available at the installation location (e.g., 12+').
- Water Meter Make: The water meter manufacturer, if applicable. Displays "N/A" when the FM350 is installed independently of a traditional water meter.
- Water Meter Model: The water meter model, if applicable. Displays "N/A" when not associated with a specific meter.
- Unit Type: The measurement unit type. Displays "N/A" when using default settings.
How to Use This SectionDuring a support call, check Installation & Calibration to confirm the FM350 is properly configured for its installation environment:
- Calibration Level is 0 or 1 → The device has not completed its initial configuration. Verify that the installer completed the pipe configuration step during the device setup process. If the install date is recent, the configuration may still be processing. If the device has been installed for more than 48 hours without reaching Level 2, escalate for review.
- Device and Monitoring Point pipe size or material do not match → This is a configuration mismatch that directly affects measurement accuracy. The FM350's reference calibration profile is specific to the pipe size and material it was configured for. If the physical pipe does not match what is configured, the device will produce inaccurate readings. Verify the actual pipe specifications on-site and update the configuration in the Admin Tool.
- Pipe Material or Pipe Size shows an unexpected value → The installer may have selected the wrong option during setup. Confirm the actual pipe material and diameter on-site. Common materials include Copper L, Copper M, PVC, CPVC, and steel. An incorrect material selection will apply the wrong reference profile.
- Water Meter Make/Model shows "N/A" → This is expected for FM350 installations that are not paired with a traditional water meter. The FM350 measures flow directly using ultrasonic transit-time measurement and does not require a mechanical meter. If the device is installed downstream of a meter and should be associated with one, update the Monitoring Point in the Admin Tool.
- Calibration Type shows something other than "Reference Calibrated" → Document the value and escalate. FM350 devices should use the Reference Calibrated profile under normal operating conditions.
Current State
The Current State section provides a snapshot of the device's firmware and battery health. Use this section to quickly confirm whether the device is running the latest firmware and whether the battery can sustain normal operations.What You'll See
- Firmware Version: The firmware version currently installed on the device. A green "(Latest)" label indicates the device is running the most current firmware. If no label is present, the device may need a firmware update.
- Battery Voltage: The current battery voltage in millivolts (mV). A healthy device typically reports above 3550 mV.
- State Machine Config: The device's operational mode. A value of "6,7 or 6,5 (Meter Mode)" indicates the device is in its standard flow-monitoring configuration. Other values may indicate the device is in a diagnostic or shipping mode.
- Battery Status: A summary assessment of battery health (e.g., Healthy). This field reflects the overall battery condition based on voltage trends, not just the current reading.
How to Use This Section
- Firmware Version does not show "(Latest)" → The device may be running outdated firmware. Check the Firmware tab in UltraSonix to determine whether an update is available and whether the device is eligible for an over-the-air update.
- Battery Voltage is at or below 3550 mV → The battery is approaching the low threshold. Cross-reference with the Battery Voltage Trend chart in Device History to determine whether the voltage is declining steadily or dropped suddenly. A gradual decline over months is expected nearing the end-of-life. A sudden drop may indicate a hardware issue.
- State Machine Config is not "6,7 or 6,5 (Meter Mode)" → The device may be in a test, diagnostic, or recovery state. This is uncommon for field-deployed devices. Escalate to engineering if the device should be in Meter Mode but is not.
- Battery Status is not "Healthy" → Plan for a device replacement. Check Device History to estimate remaining battery life based on the voltage trend.

SIM Status
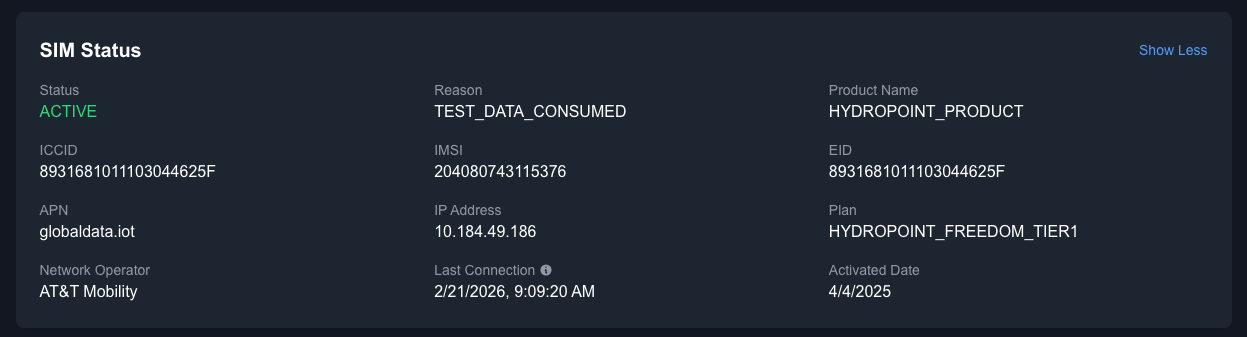
The SIM Status section displays the cellular SIM card details for the device. This information is critical when diagnosing connectivity issues that are not related to signal strength, such as carrier-level blocks, deactivated SIMs, or incorrect APN configurations.Click Show More to expand the full SIM details. Click Show Less to collapse.What You'll See
- Status: The current SIM activation state (e.g., ACTIVE, INACTIVE, SUSPENDED). A green "ACTIVE" label indicates the SIM is functioning normally.
- Reason: The reason code associated with the current SIM status (e.g., TEST_DATA_CONSUMED). This can indicate why a SIM was deactivated or flagged.
- Product Name: The SIM product profile assigned to the device (e.g., HYDROPOINT_PRODUCT).
- ICCID: The unique identifier for the physical SIM card.
- IMSI: The international mobile subscriber identity used by the cellular network.
- EID: The embedded SIM identifier.
- APN: The Access Point Name the device uses to connect to the cellular network (e.g., globaldata.iot).
- IP Address: The IP address assigned to the device on the cellular network.
- Plan: The data plan associated with the SIM (e.g., HYDROPOINT_FREEDOM_TIER1).
- Network Operator: The carrier the device is currently connected to (e.g., AT&T Mobility).
- Last Connection: The most recent time the SIM connected to the cellular network.
- Activated Date: The date the SIM was first activated.
How to Use This Section
- Status is INACTIVE or SUSPENDED → The SIM has been deactivated. Check the Reason field for context. If the suspension was unintentional, coordinate with the SIM management team to reactivate.
- Status is ACTIVE, but the device is not uploading → The SIM is functional at the carrier level, which means the issue is likely signal-related (check Connection Status and Device History) or hardware-related.
- APN is incorrect or missing → An incorrect APN will prevent the device from establishing a data session even if the SIM is active and the signal is available. Verify the APN matches the expected value for the assigned plan.
- Reason shows an unusual code → Document the Reason value and escalate to the SIM management or engineering team if the code is unfamiliar or does not match the expected device state.
Flow History
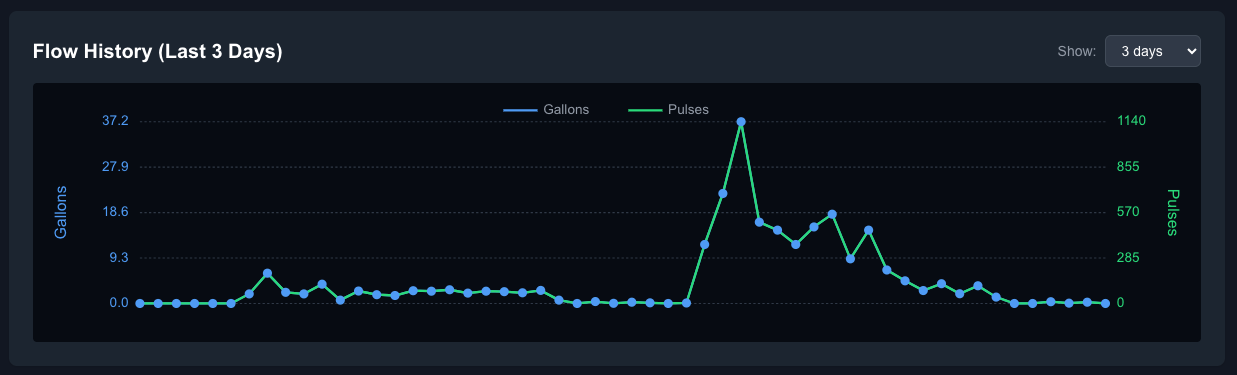
The Flow History section displays a time-series chart showing the flow data the device has recorded. This chart plots both gallons and raw pulse counts over a configurable time range, giving you a direct view of what the device is detecting at the pipe.Use the dropdown in the top-right corner to change the time range (e.g., Last 3 Days).What You'll See
- Gallons (blue line, left axis): The calculated water volume based on the device's calibrated K Factor.
- Pulses (green line, right axis): The raw pulse count detected by the device's ultrasonic sensors.
Both lines should track proportionally. When flow occurs, both gallons and pulses should rise together.How to Use This SectionFlow History helps you determine whether the device is detecting flow and whether the flow data looks normal:
- Both lines are flat at zero → The device is not detecting any flow. This could indicate that no water is flowing at the site, the device has lost coupling with the pipe, or the transducer pads are damaged. Direct the installer to verify physical installation and check for coupling gel degradation.
- Pulses are present, but gallons are flat or zero → The device is detecting raw pulses but is not converting them to gallons. This typically indicates the device has not completed calibration (check Calibration Level in Installation & Calibration) or the meter profile is misconfigured.
- Gallons show a sudden spike followed by a return to baseline → This pattern is normal for expected usage events (e.g., irrigation cycles, cooling tower fill events). Cross-reference the timing with any alerts in WaterCompass.net to confirm whether the spike triggered an alert.
- Gallons show sustained elevated flow with no return to baseline → This may indicate a leak or an open valve. Check the Alert Notifications page in WaterCompass.net to see if a Continuous Usage alert was generated.
- Pulses show erratic readings with no corresponding gallon increase → Noise in the pulse data without meaningful gallon conversion can indicate electrical interference, a loose sensor, or air in the pipe. Escalate for a physical inspection if the pattern persists.
Device History
The Device History section provides a 30-day (default) historical view of the device's reporting behavior, battery health, carrier usage, and signal quality. This is the most data-rich section on the Devices tab and is essential for diagnosing intermittent connectivity issues, battery degradation, and signal environment changes.Use the dropdown in the top-right corner to change the time range. Click the download icon to export the data.What You'll SeeSummary Cards
- Days Reported: The number of days the device successfully reported data within the selected period (e.g., 82 out of 30 days indicates multiple connections per day).
- Days Not Reported: The number of days with no data upload. Any value above 0 warrants investigation.
- Total Connections: The total number of call-ins during the period.
- Total Failures: The total number of failed connection attempts. A value above 0 indicates the device encountered connectivity issues.

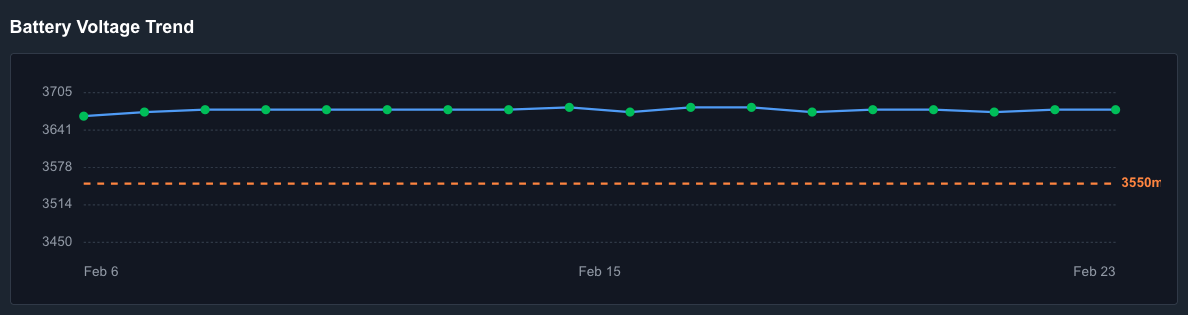
Battery Voltage TrendA line chart showing battery voltage over time. The orange dashed line at 3550 mV represents the low battery threshold. Voltage readings should remain consistently above this line.
CarriersA bar showing which cellular carrier(s) the device connected through during the period, along with the connection count and percentage breakdown (e.g., AT&T — 82, 100.0%).

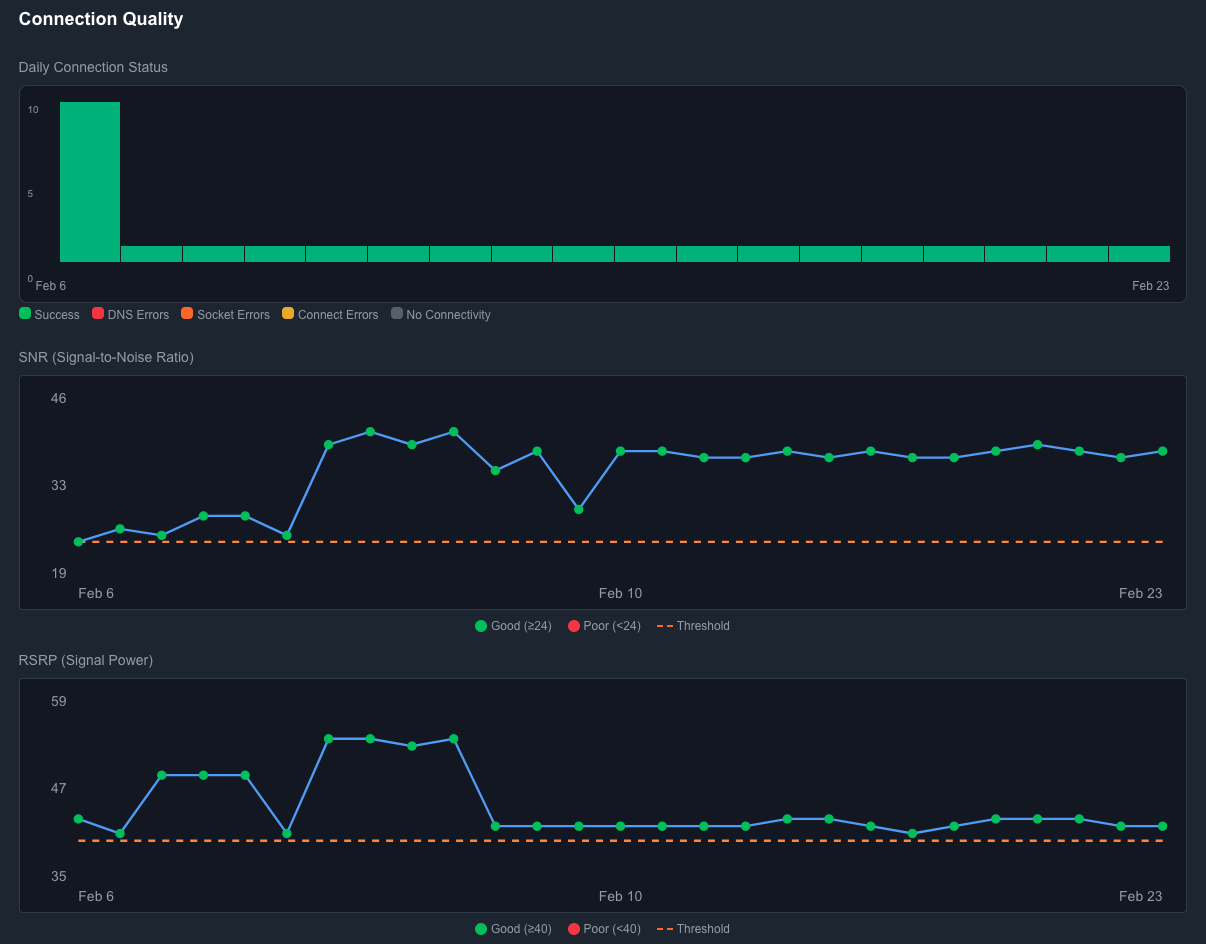
Connection Quality — Daily Connection StatusA stacked bar chart showing the daily breakdown of connection outcomes. Each bar can include:
- Success (green): Successful connections.
- DNS Errors (red): Domain name resolution failures.
- Socket Errors (orange): Network socket-level failures.
- Connect Errors (yellow): Failed connection attempts.
- No Connectivity (gray): Days with no connection at all.
SNR (Signal-to-Noise Ratio)A line chart showing the signal-to-noise ratio over time. Data points at or above the threshold (24) appear green; points below appear red. The orange dashed threshold line indicates the minimum acceptable SNR for reliable communication.RSRP (Signal Power)A line chart showing the received signal power over time. Data points at or above the threshold (40) appear green; points below appear red. The orange dashed threshold line indicates the minimum acceptable RSRP for reliable communication.
How to Use This SectionDevice History is the go-to section for diagnosing intermittent or historical connectivity problems. Work through it top-to-bottom:
- Days Not Reported is above 0 → Identify which days were missed. Cross-reference with the Daily Connection Status chart to see if those days show failures or no connectivity. If the gaps are recent and ongoing, check Connection Status for the current state.
- Total Failures is above 0 → Look at the Daily Connection Status chart to determine the failure type. DNS Errors and Socket Errors often indicate carrier-level or SIM issues. Connect Errors can indicate signal degradation.
- Battery Voltage is trending downward toward 3550 mV → The device is approaching end-of-life. Estimate the remaining time based on the rate of decline and begin planning a replacement. A sudden voltage drop (rather than a gradual decline) may indicate a hardware fault — escalate for review.
- Battery Voltage has already dipped below 3550 mV → The device is at risk of unreliable communication or shutdown. Prioritize replacement.
- Carrier shows unexpected switching or multiple carriers → Frequent carrier switching can indicate a weak signal environment where the device is hunting for the best network. Check SNR and RSRP to confirm.
- SNR is consistently below the threshold (24) → The signal environment is too noisy for reliable communication. The antenna may need to be relocated to a position with better line-of-sight to a cell tower. If below-ground, consider an external antenna extension.
- RSRP is consistently below the threshold (40) → The received signal power is insufficient. This often correlates with an obstructed or poorly positioned antenna. Consider antenna relocation or a signal booster recommendation.
- SNR is good, but RSRP is poor (or vice versa) → These metrics measure different aspects of signal quality. Good SNR with poor RSRP can indicate the device is receiving a clean but weak signal. Poor SNR with good RSRP can indicate a strong signal with significant interference. Document both values when escalating.
FM350 Only: Ultrasonic Sensor Diagnostics
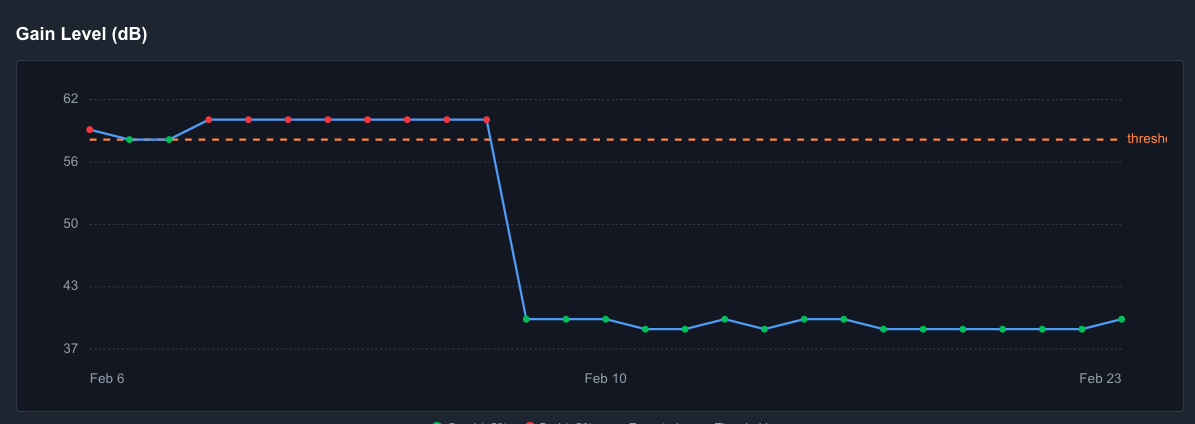
FM350 devices display two additional charts in Device History that are not present on FM250 devices. These charts provide direct insight into the health of the FM350's ultrasonic transducers and are essential for diagnosing flow measurement issues specific to the FM350.Gain Level (dB)The Gain Level chart shows how much signal amplification the FM350 is applying to detect the ultrasonic transit-time signal through the pipe. Gain is measured in decibels (dB). The orange dashed line represents the upper threshold.
- Green data points indicate the gain level is at or below the threshold — the device is detecting the ultrasonic signal without excessive amplification. This is the expected state.
- Red data points indicate the gain level is above the threshold — the device is working harder to detect the signal, which may indicate a coupling or pipe condition issue.
Lower gain values generally indicate stronger signal reception and a healthy installation. A sudden drop in gain (from high to low) can indicate the device was reinstalled, recoupled, or the pipe configuration was corrected. A sudden increase in gain can indicate coupling degradation, air gaps between the transducer pads and the pipe, or physical disturbance of the device.
How to Use the Gain Level Chart
- Gain is consistently below the threshold (green) → The ultrasonic sensor is functioning normally. No action needed.
- Gain is consistently above the threshold (red) → The device is amplifying the signal excessively to compensate for a weak ultrasonic path. Common causes include degraded or insufficient coupling gel, air bubbles trapped between the transducer pads and the pipe, incorrect pipe material or size configuration, or physical movement of the device on the pipe. Direct the installer to verify the physical installation and reapply coupling gel if needed.
- Gain was stable then suddenly increased → Something changed at the installation site. The device may have been bumped, the coupling gel may have dried out, or environmental conditions (e.g., temperature extremes, vibration) may have affected the transducer contact. Investigate the timing of the change against any site activity or work orders.
- Gain was high then dropped significantly → This typically indicates a successful intervention — the device was reinstalled, coupling gel was reapplied, or the pipe configuration was corrected. Confirm the current gain is stable and within the acceptable range.
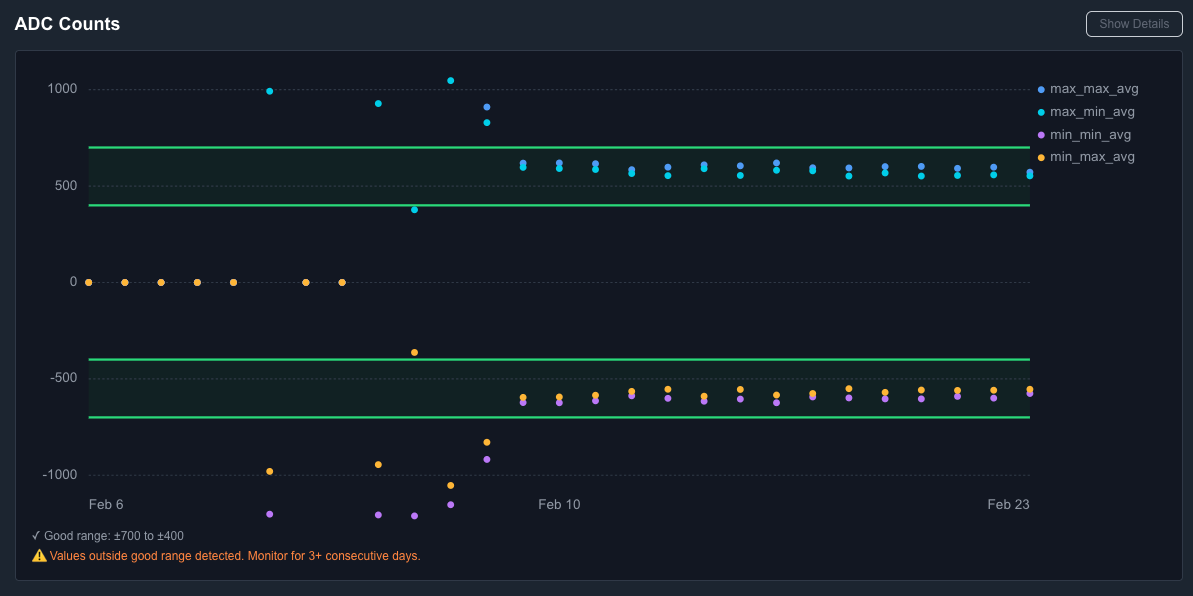
ADC CountsThe ADC (Analog-to-Digital Converter) Counts chart displays the raw signal strength values that the FM350's ultrasonic transducers are detecting. This chart plots four data series that represent the averaged signal peaks and troughs across measurement cycles:
- max_max_avg (blue): The average of the maximum positive signal peaks.
- max_min_avg (purple): The average of the maximum negative signal troughs.
- min_min_avg (pink): The average of the minimum negative signal troughs.
- min_max_avg (yellow): The average of the minimum positive signal peaks.
The green horizontal bands represent the good range: +/-400 to +/-700. Data points should fall within these bands during normal operation. The positive values (upper band) and negative values (lower band) should be roughly symmetrical, indicating a balanced ultrasonic signal.Click Show Details in the top-right corner to view the underlying data values.A yellow warning — "Values outside good range detected. Monitor for 3+ consecutive days." — appears when any data points fall outside the green bands.
How to Use the ADC Counts Chart
- All data points are within the green bands → The ultrasonic transducers are receiving a healthy, balanced signal. No action needed.
- Data points are clustered near zero → The transducers are detecting very little or no signal. This typically indicates a winterized irrigation meter, severe coupling issue, air gap, or transducer damage. The device is unlikely to measure flow accurately in this state. Escalate for physical inspection.
- Data points are outside the green bands, but the warning says to monitor for 3+ consecutive days → Isolated excursions outside the good range can occur during transient conditions (e.g., air in the pipe, brief vibration events, change in temperature). If the values return to the green bands within a few days, no action is needed. If values remain outside the bands for 3 or more consecutive days, the installation should be inspected.
- Data points are far outside the bands (e.g., near +/-1000 or beyond) → The signal is significantly outside the expected range. This can indicate the device was recently installed or reconfigured and the signal has not yet stabilized, or it can indicate a physical issue with the installation. Cross-reference with the Gain Level chart — if gain is also elevated, the root cause is likely coupling or mounting-related.
- Positive and negative values are asymmetrical → If the upper band values are consistently much larger or smaller than the lower band values, the ultrasonic signal path may be uneven. This can indicate the device is not centered on the pipe, one transducer pad has better contact than the other, or the pipe has internal deposits or irregularities affecting signal propagation on one side.
Tip: When troubleshooting FM350 flow issues, read the Gain Level and ADC Counts charts together. Gain tells you how hard the device is working to hear the signal. ADC tells you what the device is actually hearing. A device with high gain and ADC values near zero is struggling to detect any signal — this is a physical installation issue. A device with normal gain but erratic ADC values may have an intermittent coupling or pipe condition problem.
Signal to Noise Ratio (SNR) Graph: A time-series graph showing signal quality over time. A line above the orange threshold line indicates acceptable quality. Below the orange threshold may cause intermittent or failed uploads.
Signal Strength & Signal Noise Reference
Signal strength (RSRQ) and Signal to Noise (SNR) values are recorded with each device upload and can be reviewed in the UltraSonix Dashboard and in the Admin Tool Device Log.
Signal Strength (RSRQ)
| RSRQ Value | Rating | Action Required |
Signal to Noise Ration (SNR)
Where to Find These Values
- UltraSonix Dashboard: The SNR graph in Connection Status shows ongoing signal quality. Most recent RSRQ and SNR values are displayed when the device last communicated.
- Admin Tool - Device Log: Provides a history of signal strength and SNR recorded with each device upload. Use this to identify degradation trends over time.
- WaterCompass Installer App: Signal Strength is visible when connected via Bluetooth.
Note: If the device battery is dead and also shows poor signal strength, antenna placement should be evaluated and corrected when the field technician replaces the device. Document both issues in the Field Service Request.
Work Orders
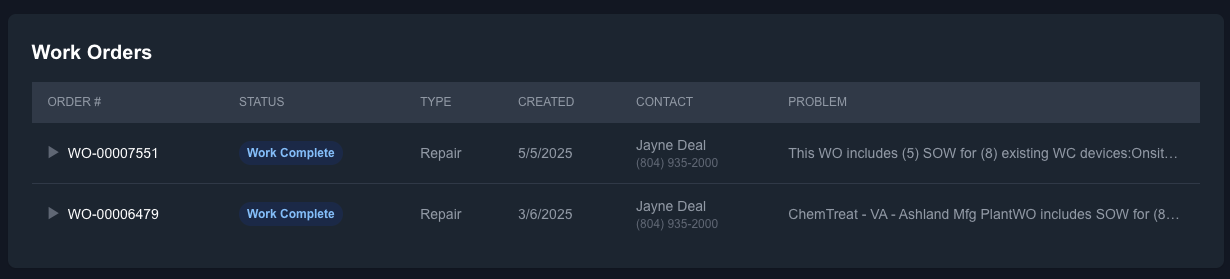
The Work Orders section lists all work orders that have been created for this device. Use this section to check whether field service has been requested or completed.What You'll See
- Order #: The unique work order identifier.
- Status: The current state of the work order (e.g., Work Complete, Open, In Progress).
- Type: The category of work (e.g., Repair, Install, Swap).
- Created: The date the work order was created.
- Contact: The name and phone number of the field contact.
- Problem: A brief description of the issue or scope of work.
Click the expand arrow next to any work order to view additional details.Tip: If a device has an ongoing issue and no open work order exists, this section confirms that field service has not yet been initiated.
Service Cases
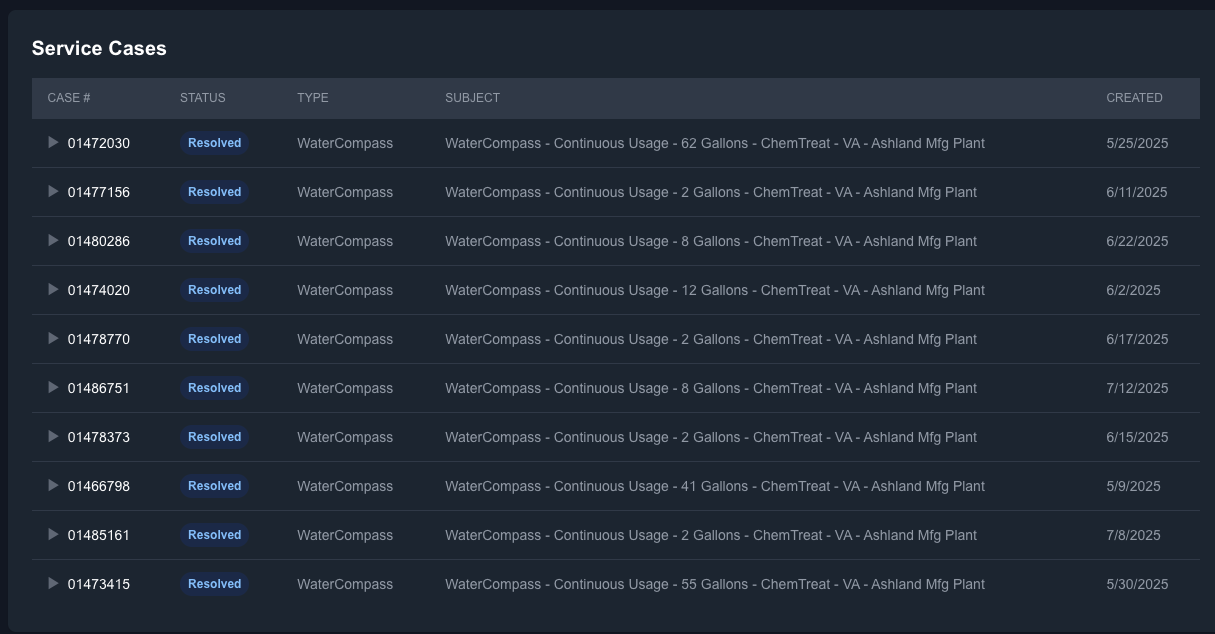
The Service Cases section displays all Salesforce service cases associated with this device. Use this section to review the support history and determine whether an issue has already been documented or resolved.What You'll See
- Case #: The Salesforce case number.
- Status: The current case status (e.g., Resolved, Open, Escalated).
- Type: The case type (e.g., WaterCompass).
- Subject: A brief description of the issue, typically including the alert type, usage amount, company, and site name.
- Created: The date the case was created.
Click the expand arrow next to any case to view additional details.Tip: Before creating a new service case, check this section to confirm whether the issue has already been reported. The Subject field often contains enough detail to determine whether a prior case covers the same problem.