
The Hydropoint Data Thresholding Calculator application is a valuable addition to our admin tools, enhancing our support for WaterCompass customers. This cutting-edge tool greatly reduces the time needed to analyze water consumption data and determine optimal threshold settings and breakpoints. Its implementation brings enhanced efficiency to both our Pro Services and Customer Success teams.
In This Article
- System Requirements
- Pre-Analysis Requirements
- Threshold Options
- Using the Calculator
- Alert Threshold History Report
System Requirements
Before employing the WC threshold calculator, the end user must have access to the following resources:
| HPDS VPN | Contact the IT department if you do not have access to the VPN. |
| WC Threshold Calculator | |
| WC Dashboard | |
| HPDS Admin Tool |
Pre-Analysis Requirements
During the data review for thresholding purposes, ensure that the start and end dates encompass a complete 24-hour period of data. This approach prevents the algorithm from relying on partial days of data for the calculation of thresholding settings, particularly in relation to the tiered catastrophic leaks settings.
| Monitoring Point | Confirm the monitoring point data thresholds require review. |
| Data Review | Identify baseline consumption, anomalies, or outliers in the data. |
| Threshold Type | Apply thresholds individually or to all threshold types. |
| Start Date | Pinpoint threshold start date using available dashboard data. |
| End Date | Typically the day before the date thresholding is completed. |
Threshold Types
Choose the threshold types you wish to generate using the threshold calculator. The tool allows you to select individual settings for specific threshold types or apply settings universally across all threshold types simultaneously.
| Continuous Slow Leak | Identifies slow continuous consumption in between 12am - 12pm. |
| Daily High Usage | Identifies high consumption for any given day of the week. |
| Catastrophic Leak | Identifies high hourly consumption |
Threshold Options
The threshold calculator offers a range of choices for water data thresholding. Each option is tailored to distinct thresholding scenarios, including the installation of a new monitoring point or the thresholding of an existing monitoring point installation.
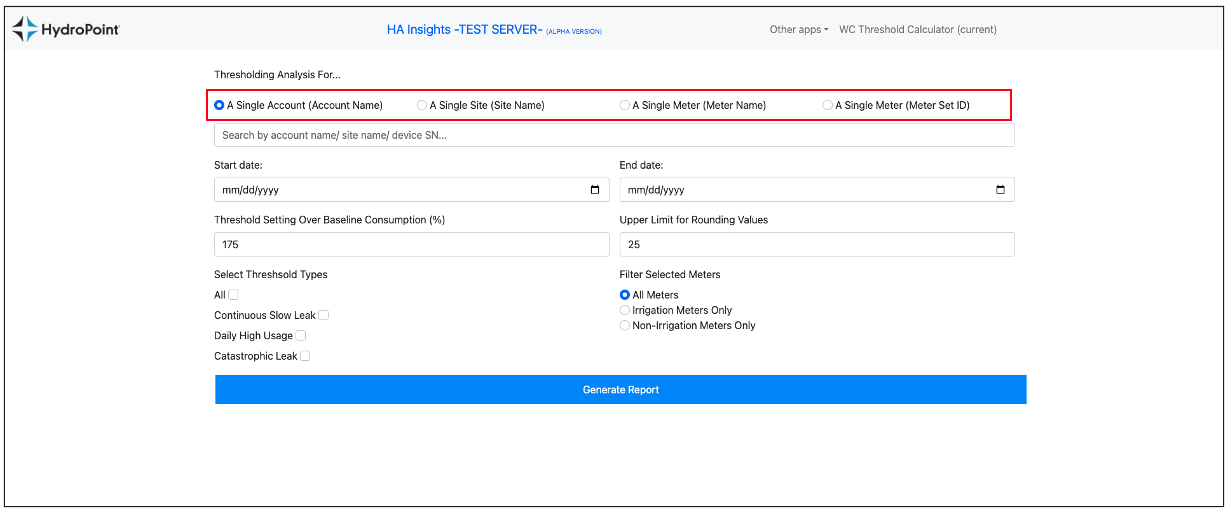
| Single Account (Account Name) | Imposes thresholds on all water meters listed under a single account. |
| Single Site (Site Name) | Imposes thresholds on all water meters listed under a single site. |
| Single Meter (Meter Name) | Imposes thresholds on an individual water meter, based on its unique name. |
| Single Meter (Meter Set ID) | Imposes thresholds on an individual water meter, based on the meter set ID. |
Using the Threshold Calculator
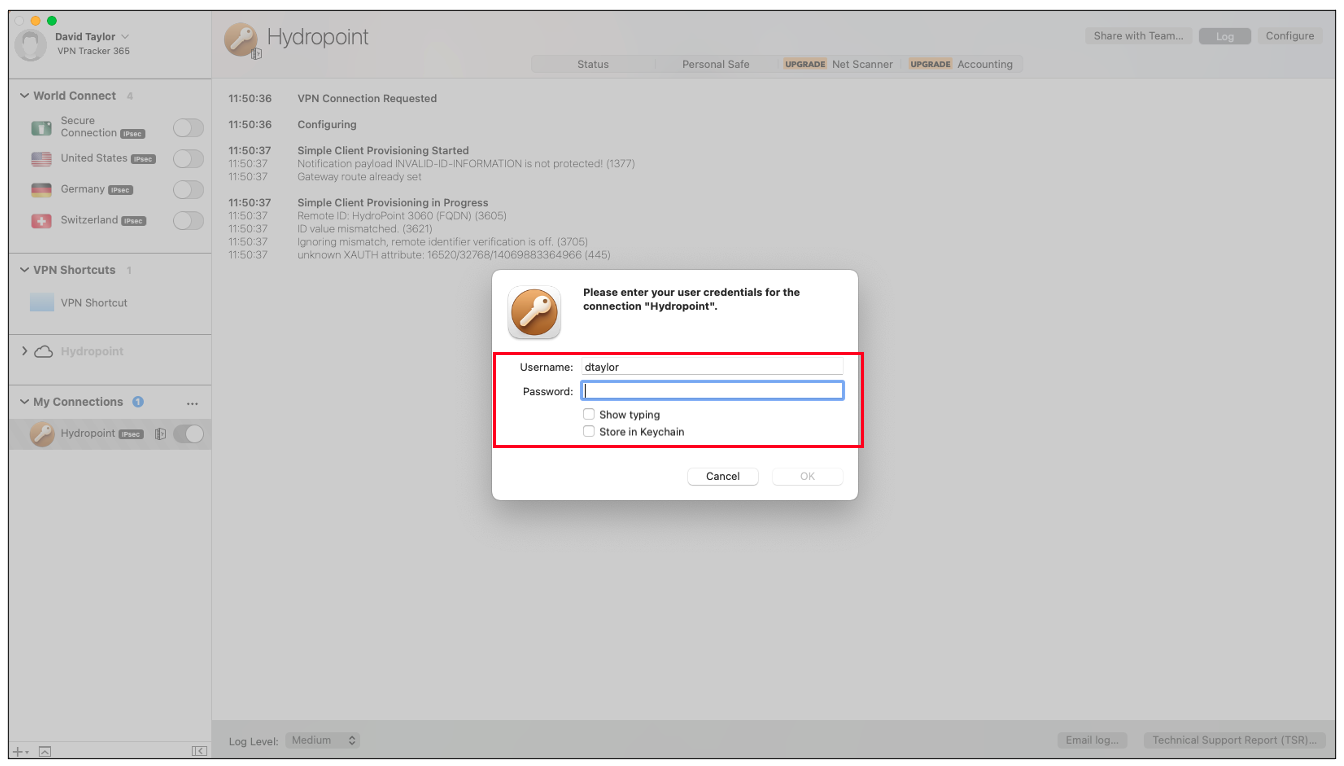
Step 1: Connect to the HPDS VPN
Login to VPN Tracker 365 and connect to the Hydropoint VPN using your credentials.
Step 2: Access the WC Threshold Calculator
Access the WC Thresholding Calculator web application while connected to the VPN.
Click here to access the WC Threshold Calculator Web Based Application
Step 3: Select Thresholding Option
Initiate the thresholding analysis by specifying your preferred method. Refer to the threshold options provided at the beginning of the document for additional information on available thresholding choices.
Step 4: Search by account name/site name/meter name
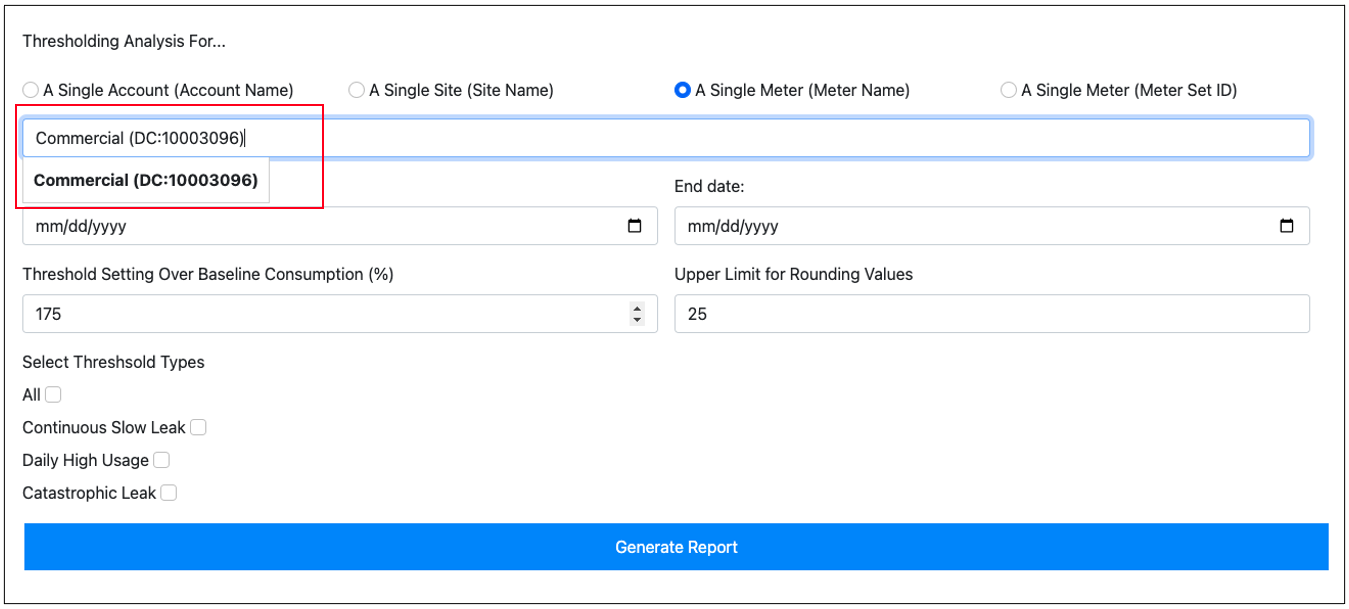
Input the account, site, or water meter details for the monitoring point you intend to threshold. Ensure the system acknowledges the entered data before proceeding.
Please be aware: If the system cannot locate the water meter name, verify the water meter name in the Admin Tool. There might be a space or a missing space that hinders the system from recognizing the water meter name.
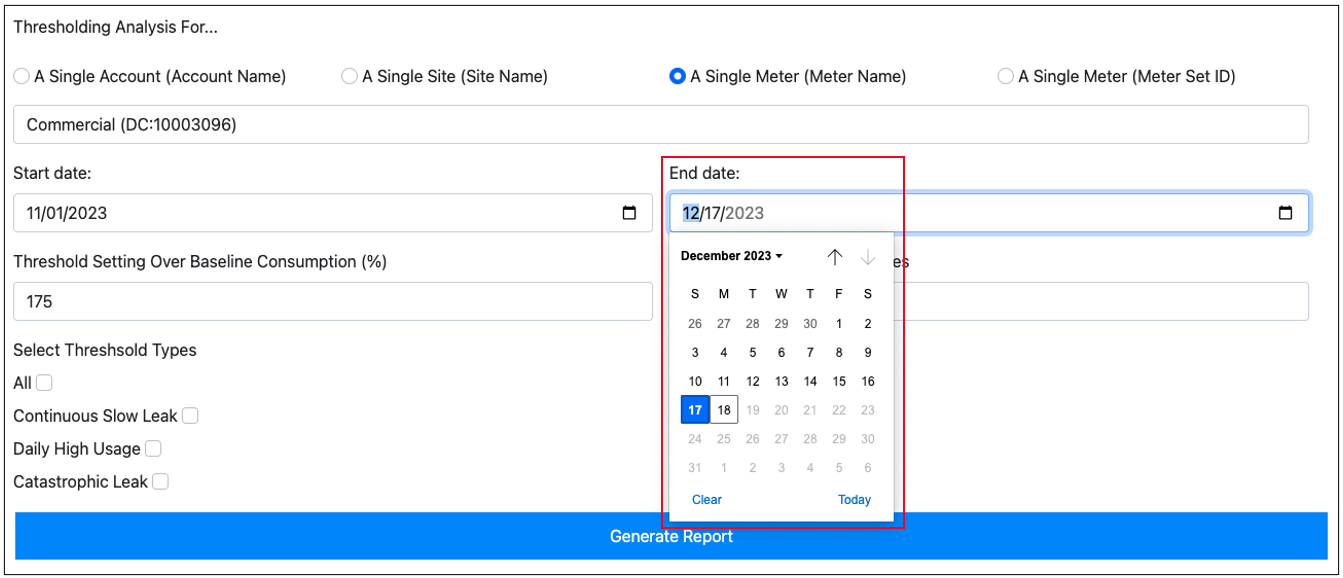
Step 5: Identify the Start Date and End Date
Identifying the start and end dates for thresholding is a crucial step in the process. The data calculator will assess the information available between these dates to establish threshold values.
It is advisable to choose days with a complete 24 hours of available data for both the start and end dates. This ensures that the algorithm takes into account full days' worth of data rather than partial days.
For the Start Date, examine the monitoring point data on the WaterCompass dashboard to select the date from which you will commence the thresholding process.
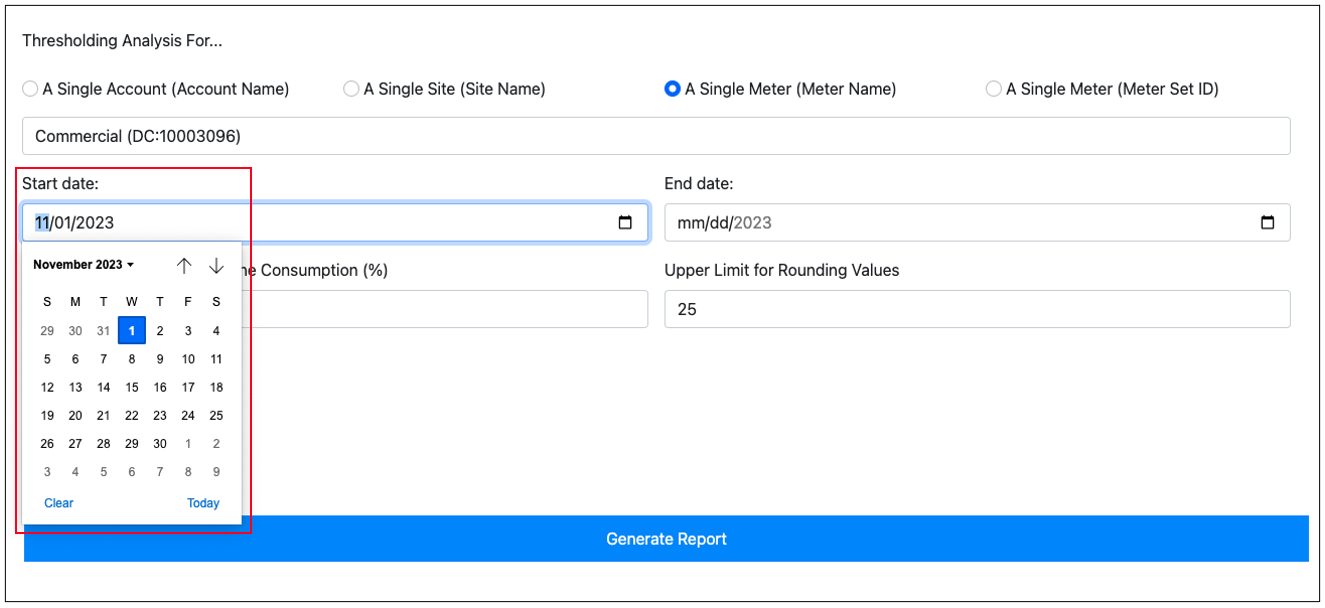
As for the End Date, in most cases, consider using the day prior to the date you are updating thresholds.
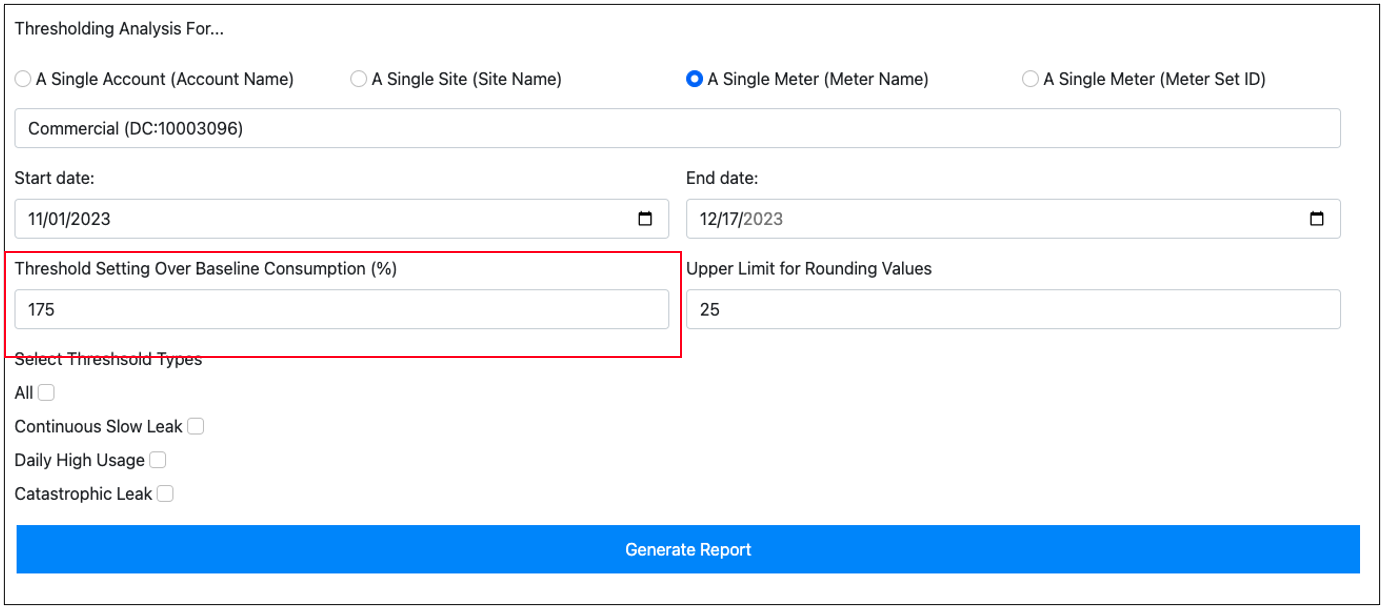
Step 6: Verify the Threshold Setting Over Baseline Consumption (%)
The Threshold Setting Over Baseline Consumption (%) represents the percentage by which the system calculates the threshold setting above the baseline consumption determined by the threshold calculator.
The default value for the Threshold Setting Over Baseline Consumption (%) is 175. This field is customizable and can be adjusted based on customer feedback.
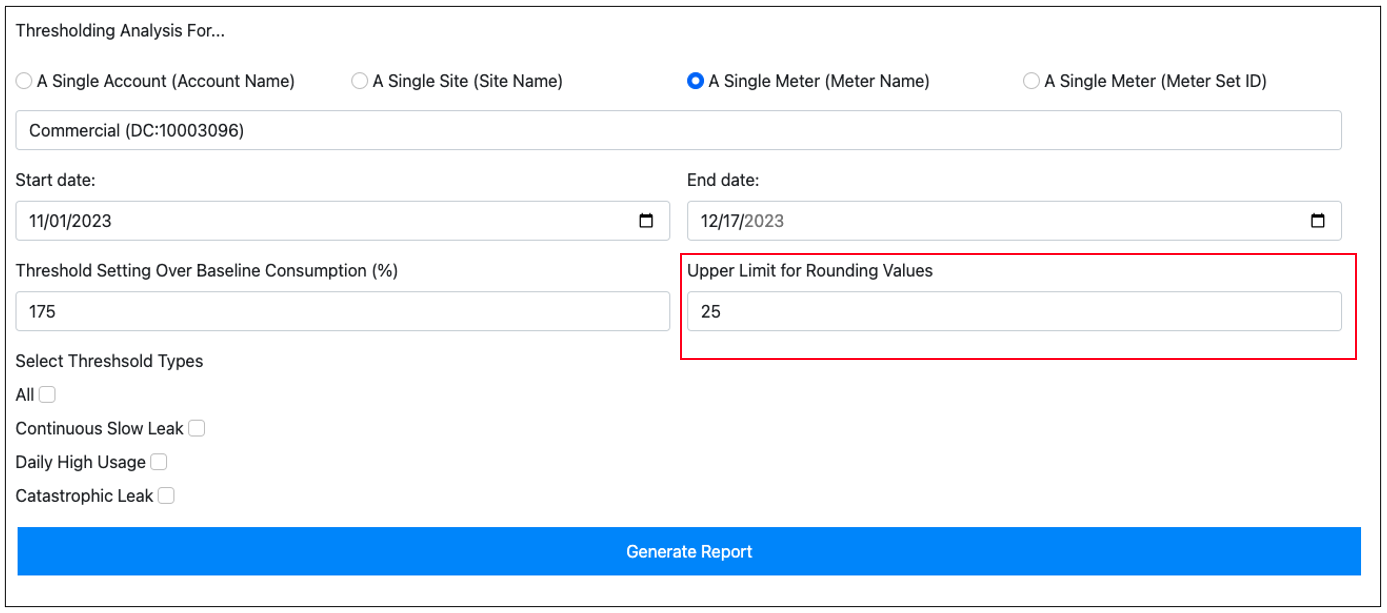
Step 7: Verify the Upper Limit for Rounding Values
The Upper Limit for Rounding Values represents the value by which the system will round the threshold value when an odd threshold value is determined.
The default for the Upper Limit for Rounding Values is 25. This field is customizable and can be adjusted based on customer feedback.
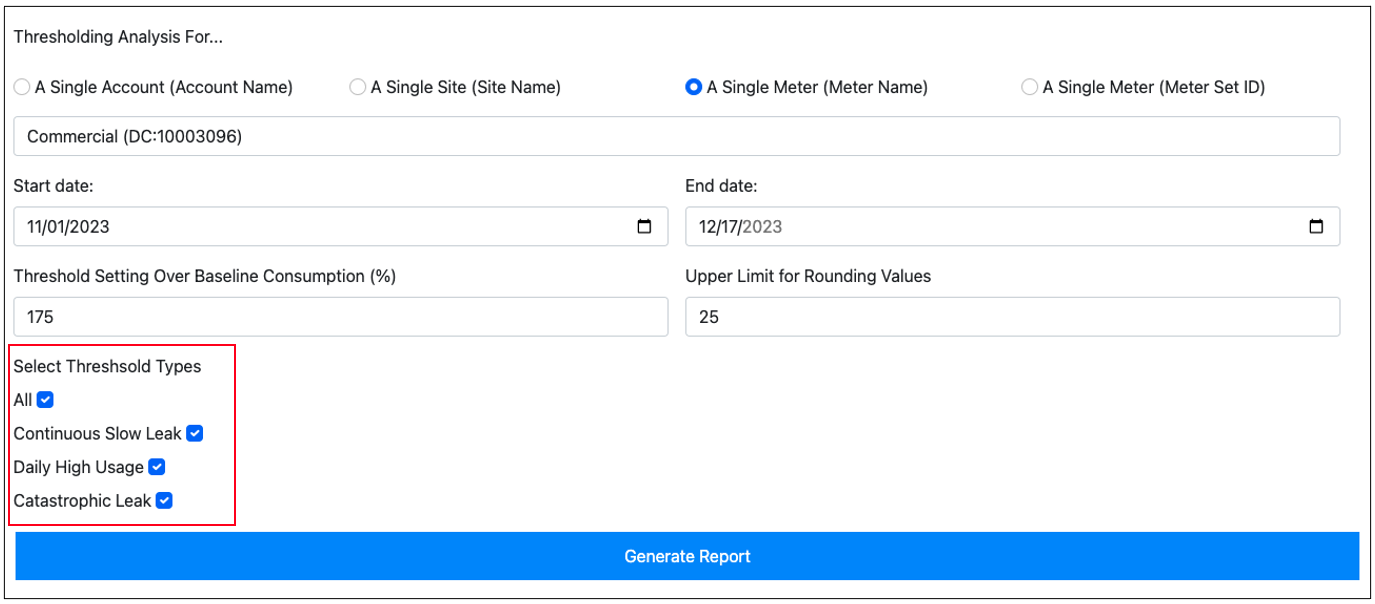
Step 8: Select the Threshold Types
The threshold calculator provides the flexibility to choose individual threshold types for generating threshold values or select all to generate a comprehensive report encompassing all available threshold types.
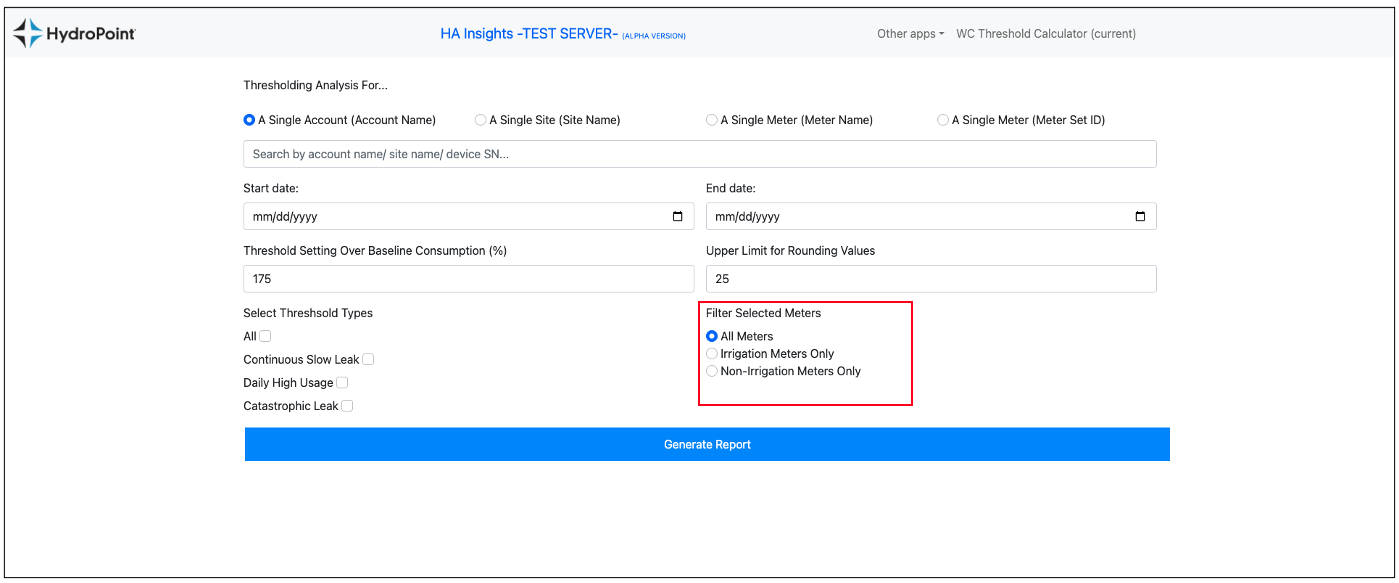
Step 9: Filter Selected Meters
While the meter filter defaults to displaying all meters, you have the option to refine the view by selecting either irrigation or non-irrigation meters exclusively. This functionality enables you to filter and manage thresholds specifically for all irrigation meters on a single site.
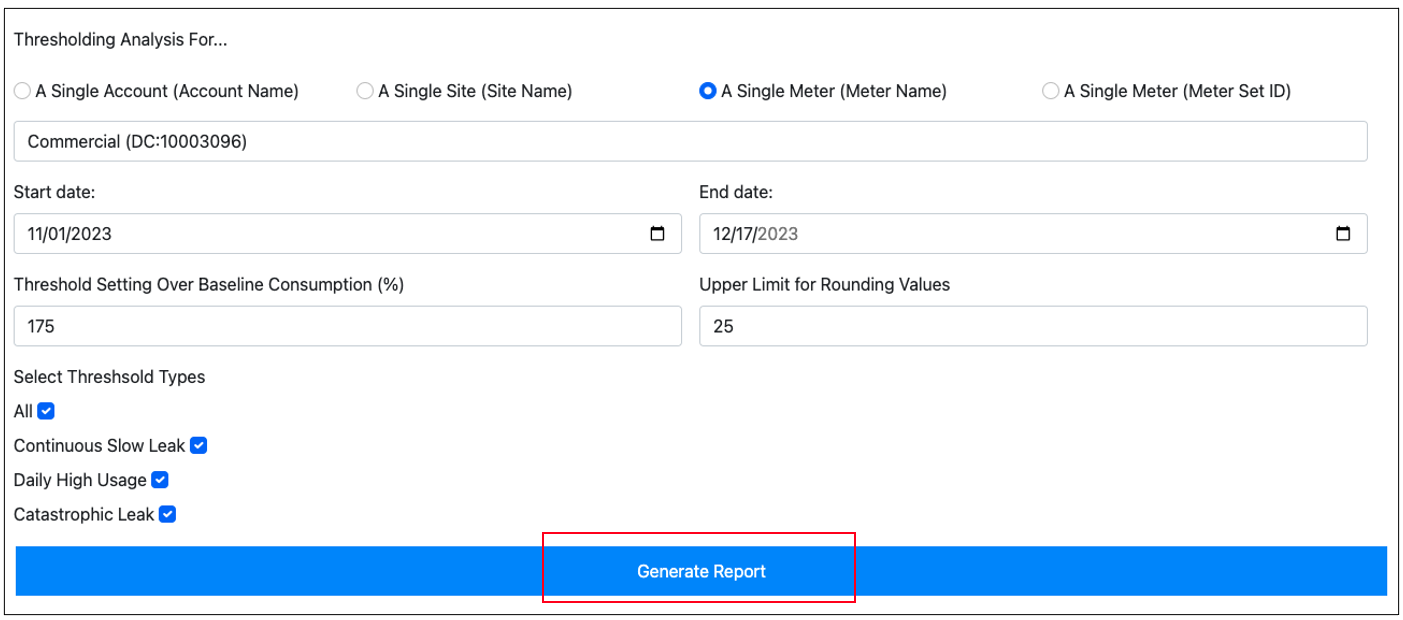
Step 10: Generate Threshold Report
Click on 'Generate Threshold Report' when all necessary data fields have been completed, and you are prepared to generate the threshold values for your chosen parameters.
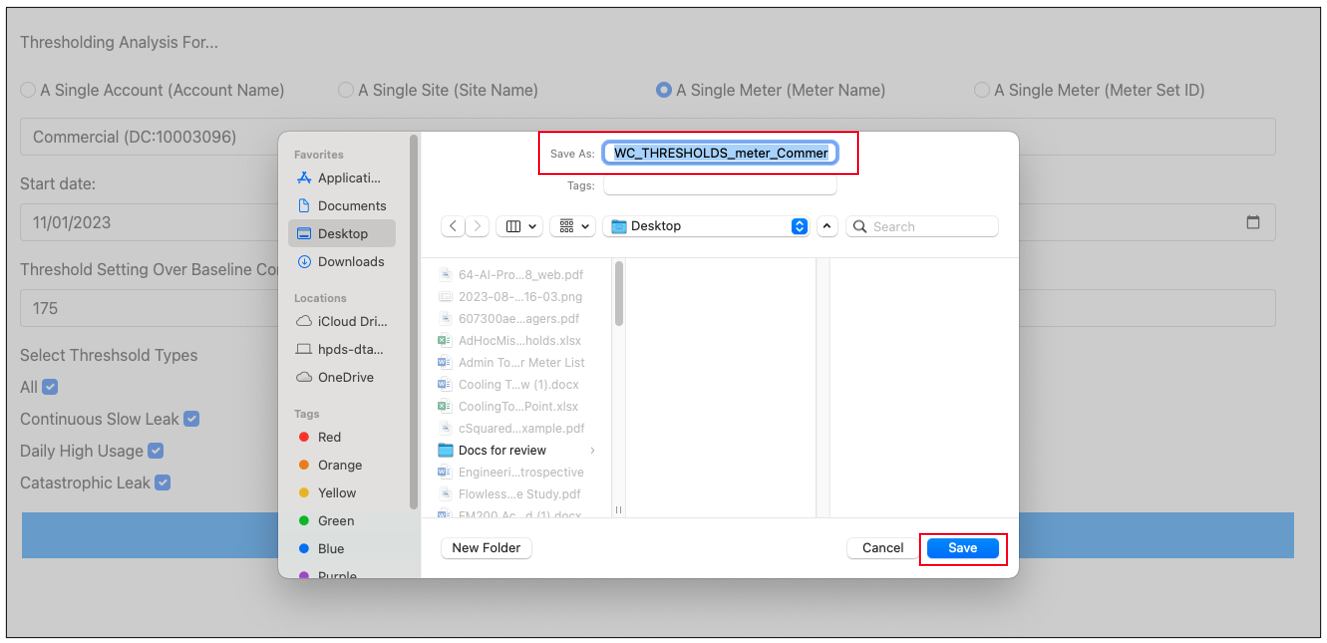
Step 11: Save the Report
The threshold report will be generated as an Excel document. Select a convenient location on your computer to save the Excel threshold output report.
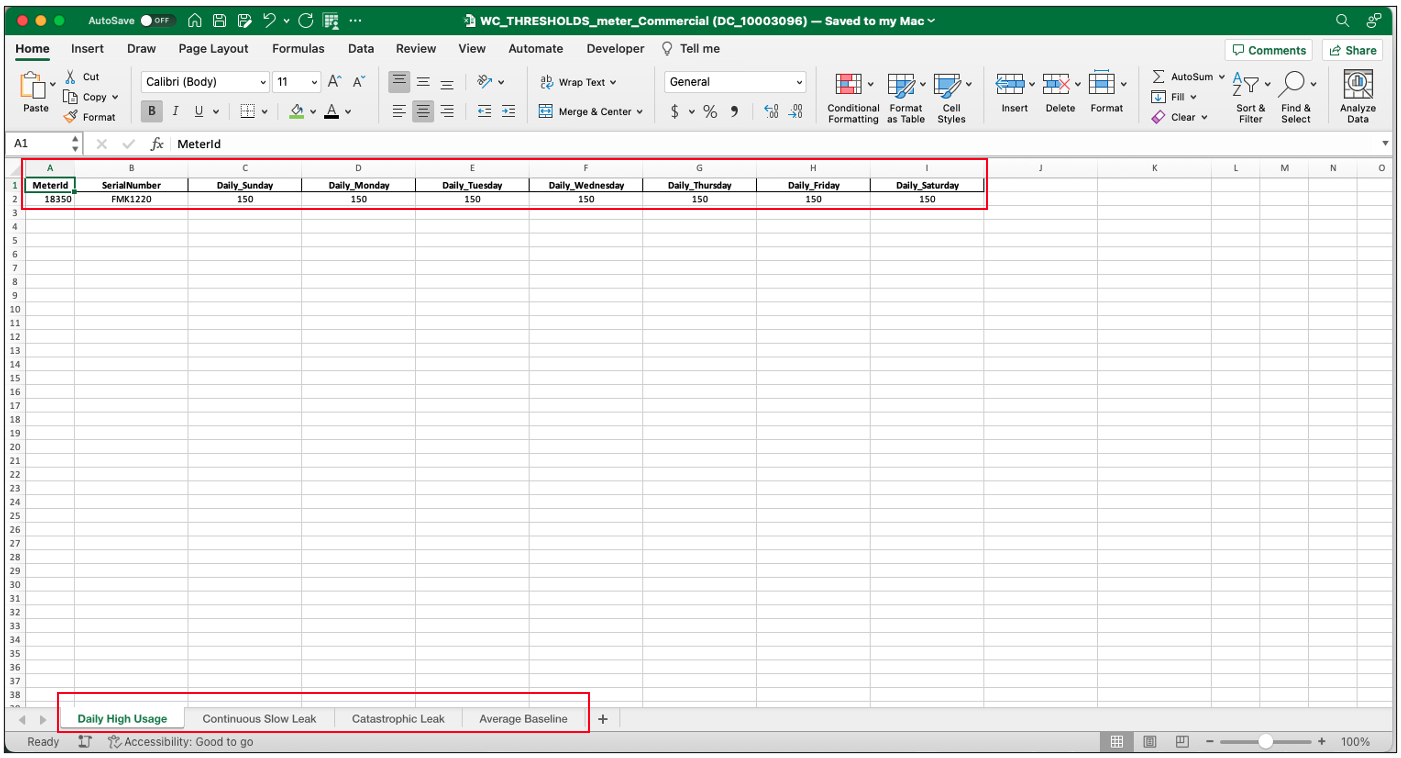
Step12: Review the Report
Examine the Excel output report in preparation for entering the value into the HPDS Admin Tool. Each alert type will have a dedicated tab within the report containing the corresponding threshold values.
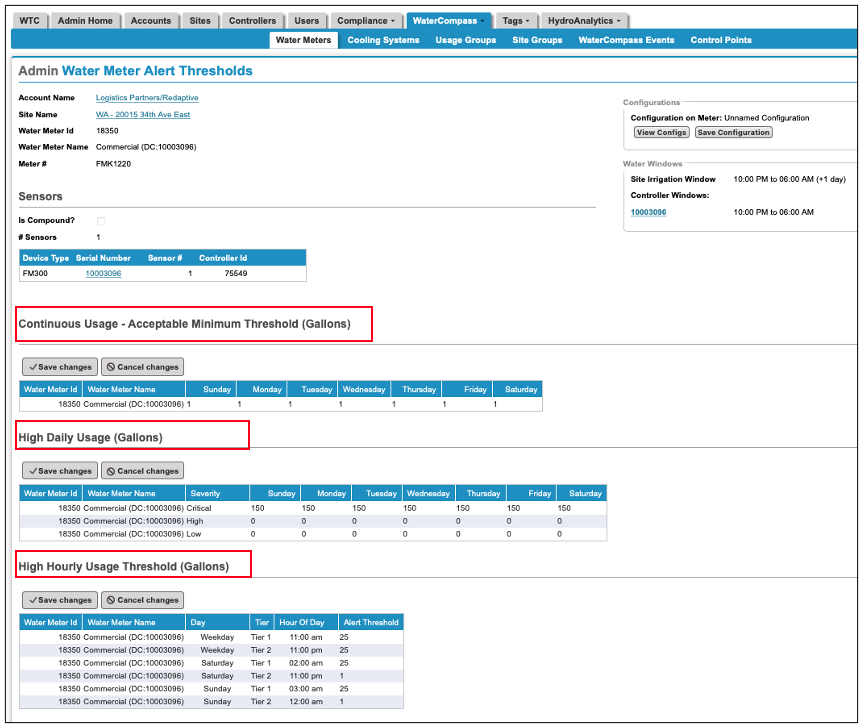
Step 13: Apply Threshold Values
Implement the threshold values, incorporating Tier 1 and Tier 2 start times, on the 'Manage Thresholds' page within the HPDS Admin Tool. Input the values from the Excel report into the corresponding fields for continuous usage, high daily, and high hourly usage thresholds.

Step 14: Verify Threshold Values against the data
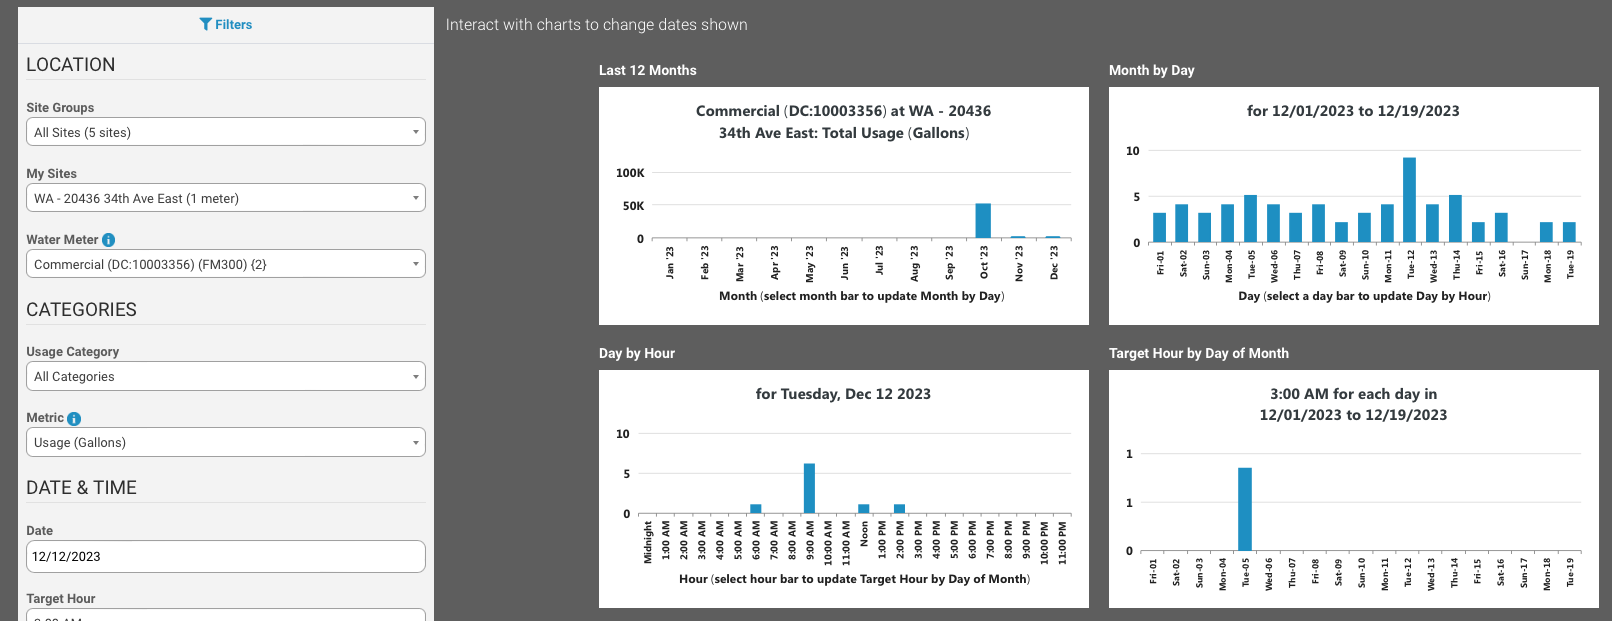
Validate the threshold values computed by the threshold calculator against the data displayed on the interactive analytics dashboard to identify any potential issues or points of concern that could trigger false alarms. Make manual adjustments as needed.
Alert Threshold History Report
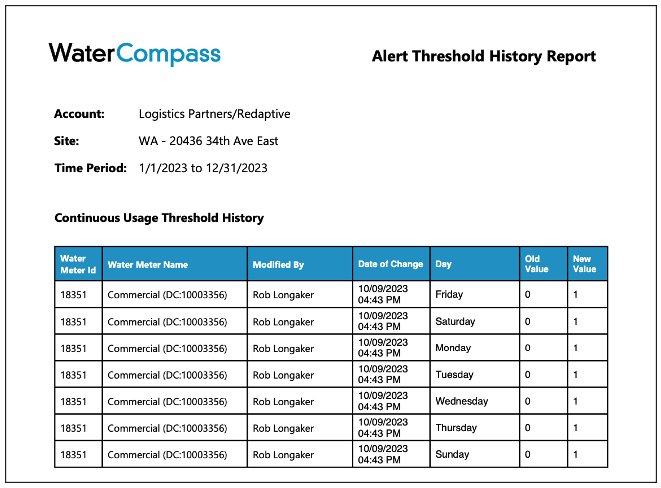
The HPDS Admin Tool features an audit log that records the origination or updates of thresholds along with the responsible party. This valuable tool proves beneficial for reviewing historical threshold configurations, pinpointing alterations, and implementing past thresholds when relevant.
Accessing the Alert Threshold History Report
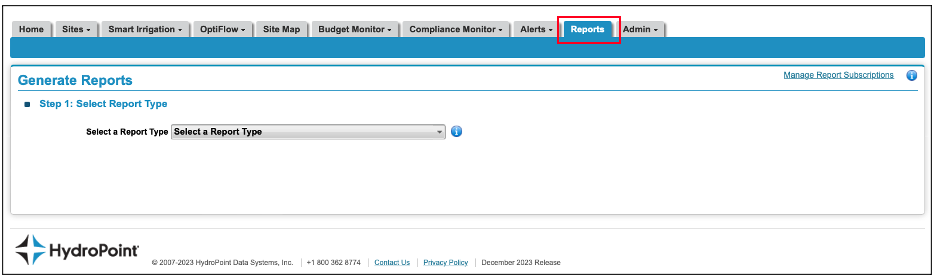
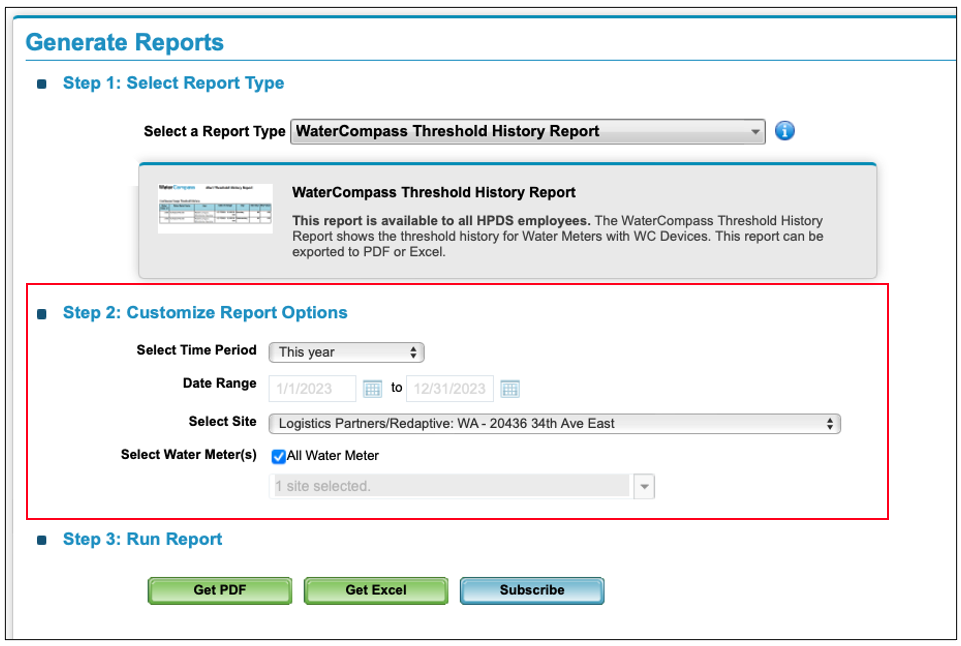
Step 1: Select a Report Type
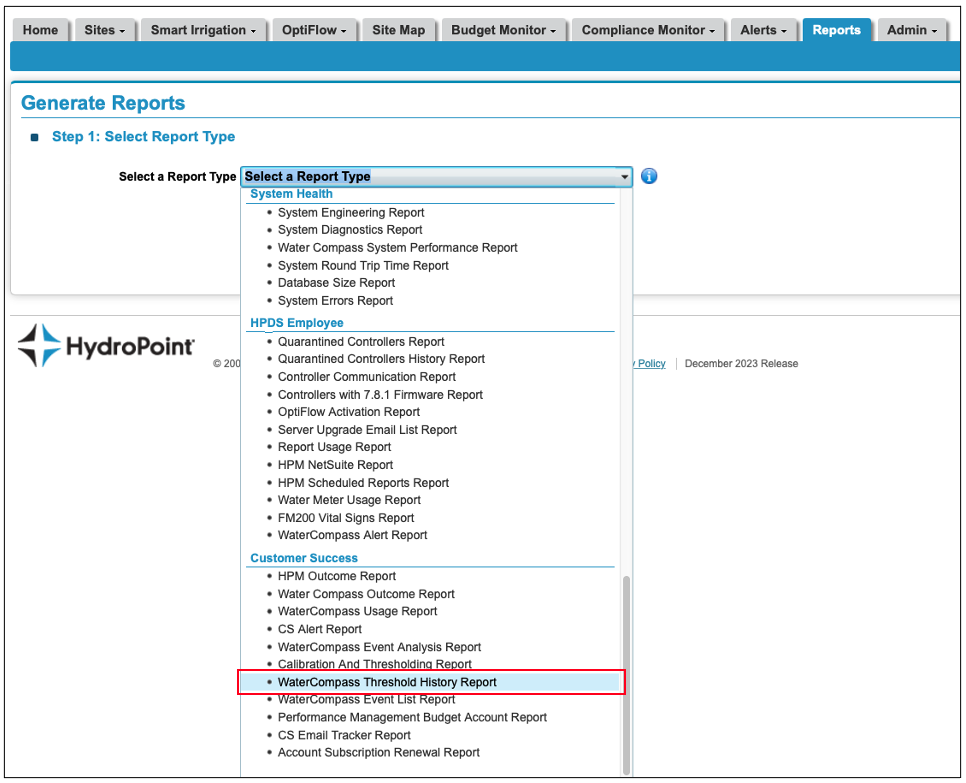
Navigate to the Reports tab within the Admin Tool and choose the WaterCompass Threshold History Report from the available pick list options.
Step 2: Customize Report Options
Choose the desired time period, site name, and water meters for which you wish to generate the report.
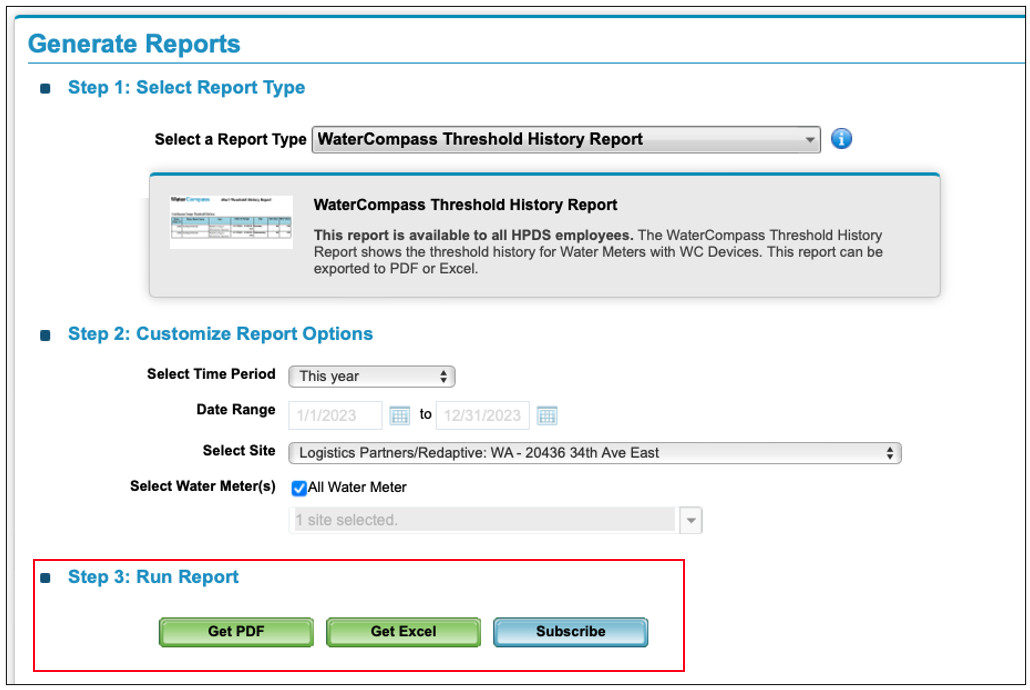
Step 3: Generate Report
Choose the desired report format and export the report for review.
Step 4: Review the Report
The report will generate as PDF or Excel document, depending on your selection. Each alert type will have a dedicated page(s) in the report.
Future Enhancements
The Product Management and Data Services team is committed to the ongoing development and enhancement of the WC Threshold Calculator beyond its initial release. Future plans include implementing streamlined improvements and increased automation. Some of the anticipated enhancements encompass, but are not restricted to, the following:
- Automate the threshold application process in the Admin Tool.
- Improve the algorithms ability to identify anomalous usage in baseline data.
- Incorporate the threshold calculator directly into the Admin Tool.
- Increased visibility in the Admin tool to installation and calibration dates.

© Copyright 2026 HydroPoint Data Systems, Inc. All rights reserved. HydroPoint, the HydroPoint logo, and WaterCompass are either registered trademarks or trademarks of HydroPoint, Inc. Other trademarks may be held by their respective owners.